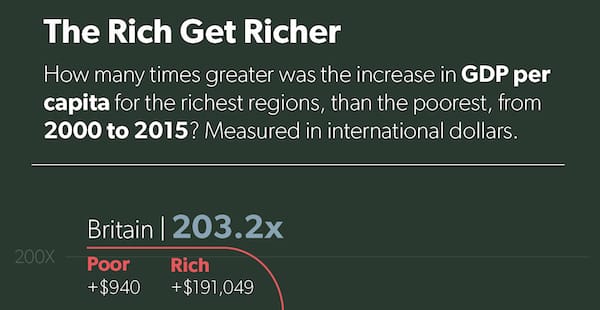
ray vella Two commendable student projects, showing different standards of beauty Kaiser discusses two dataviz projects by NYU students.
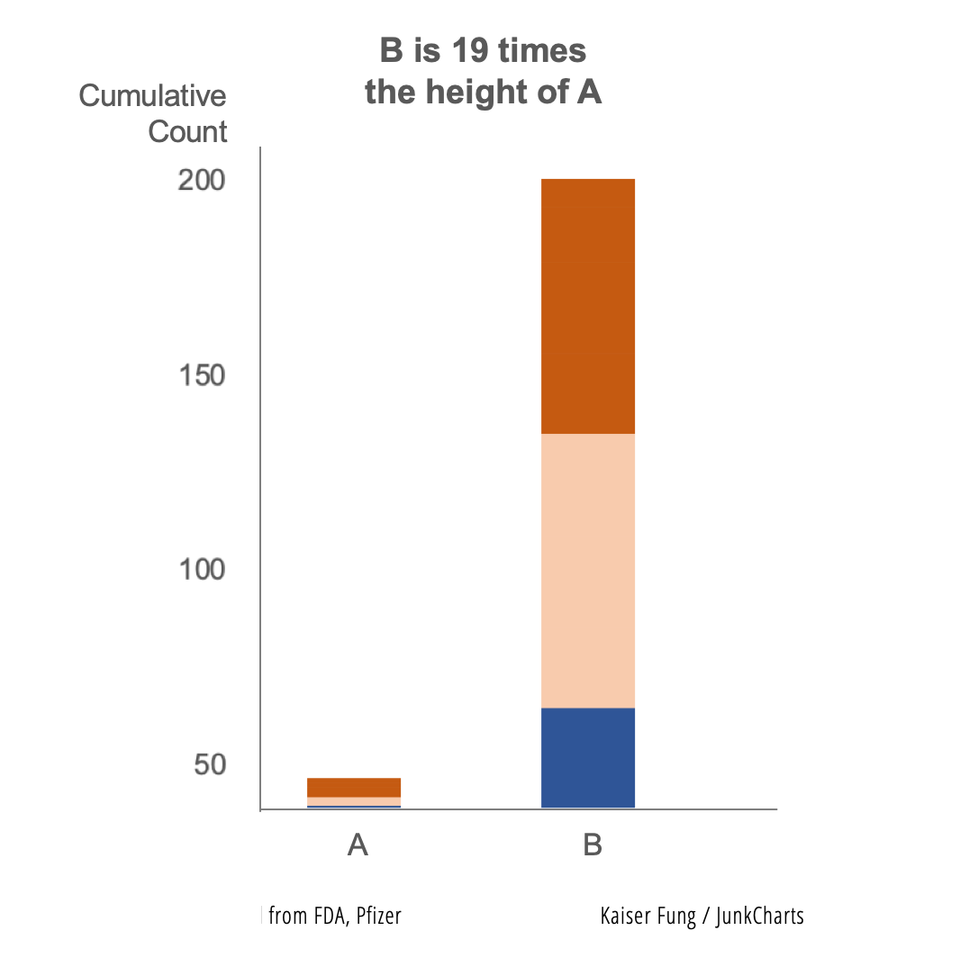
Axis Vaccine researchers discard the start-at-zero rule Kaiser revisits the practice of manipulating the vertical axis of a column chart.
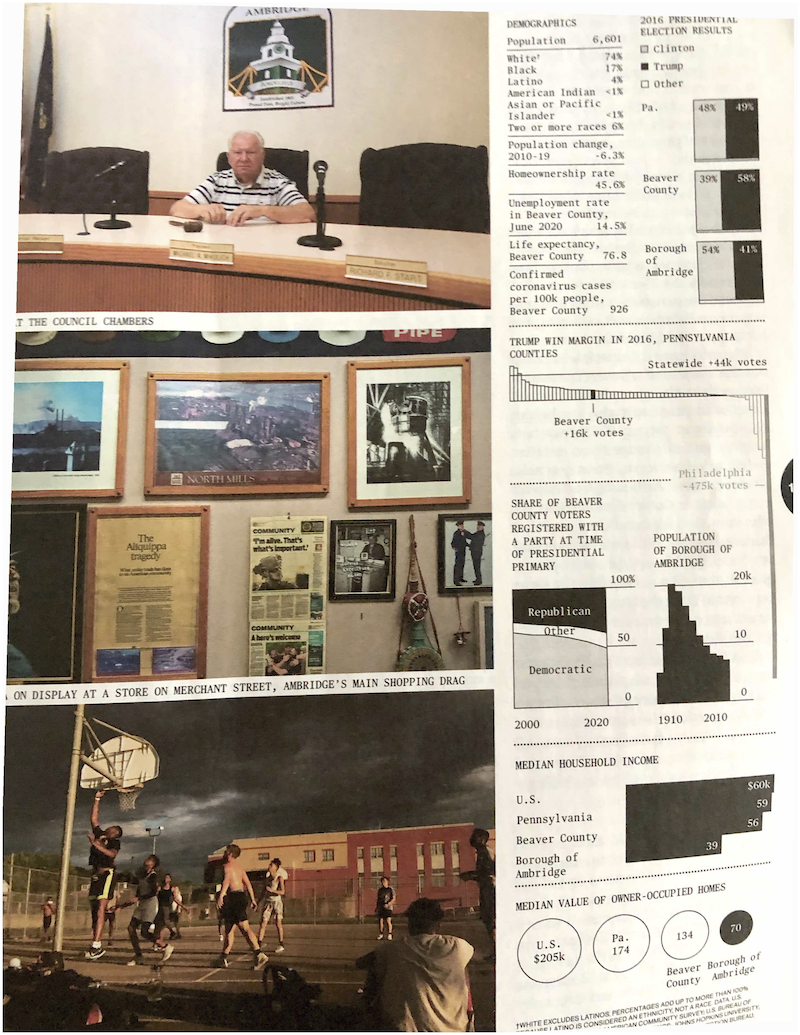
return on effort Bloomberg made me digest these graphics slowly Kaiser enjoys reading the graphics in the Businessweek issue on elections.
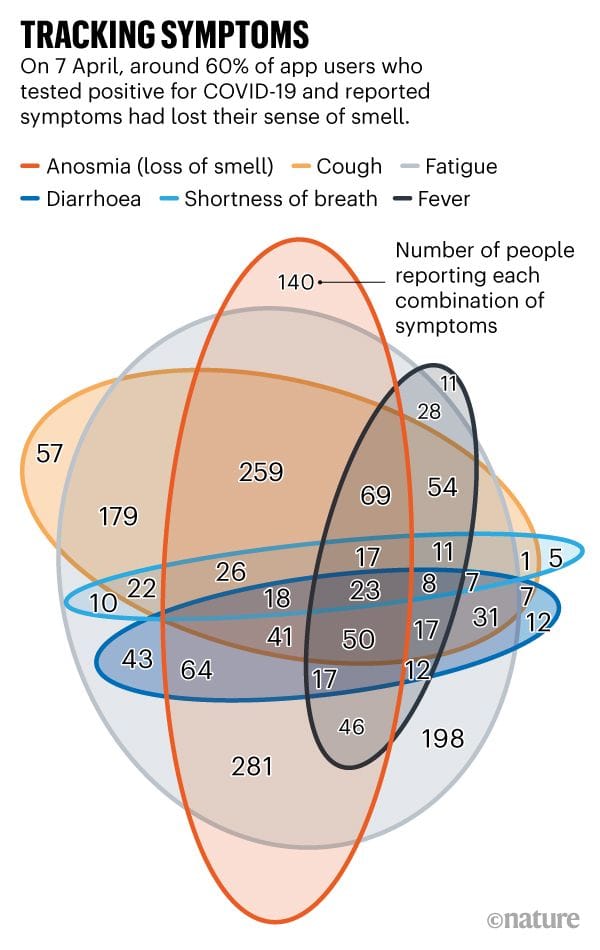
venn diagram This exercise plan for your lock-down work-out is inspired by Venn Kaiser Fung proposes a work out plan for the Covid-19 lockdown.
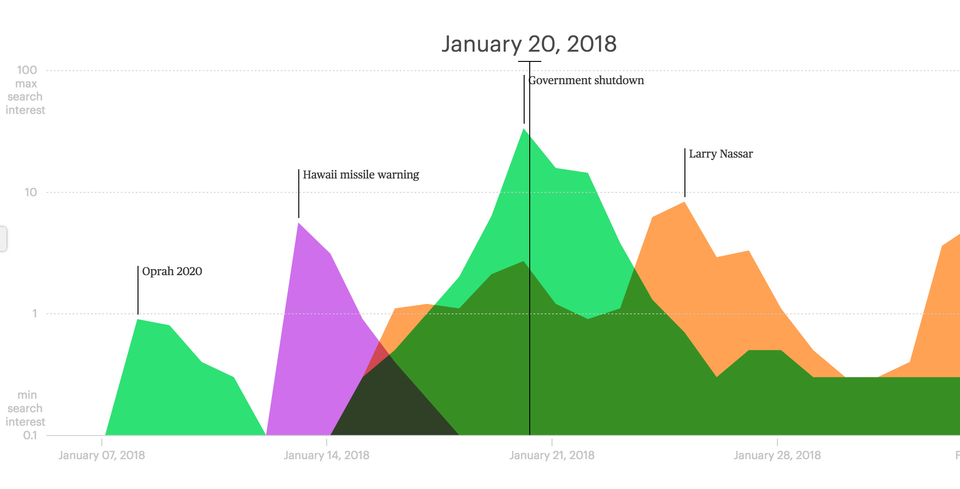
Aggregation Check out the Lifespan of News project Kaiser Fung (Junkcharts, Principal Analytics Prep) reviews the Lifespan of News project that tracks the rise and fall of news stories over time and space, using Google search data.