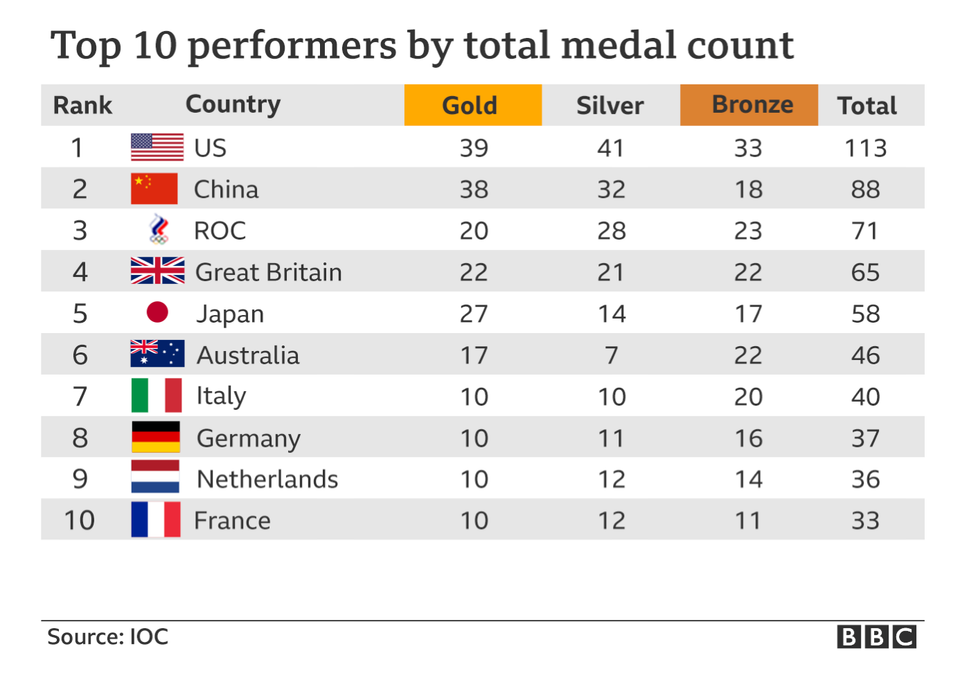
Big Data Round 2: 10 Ways to Rank the Rio Summer Olympics Kaiser finds another set of 10 metrics that can be used to rank any country top of the medals table.
Models Primer on Regression Adjustments 1 Kaiser starts a series of posts about regression adjustments.
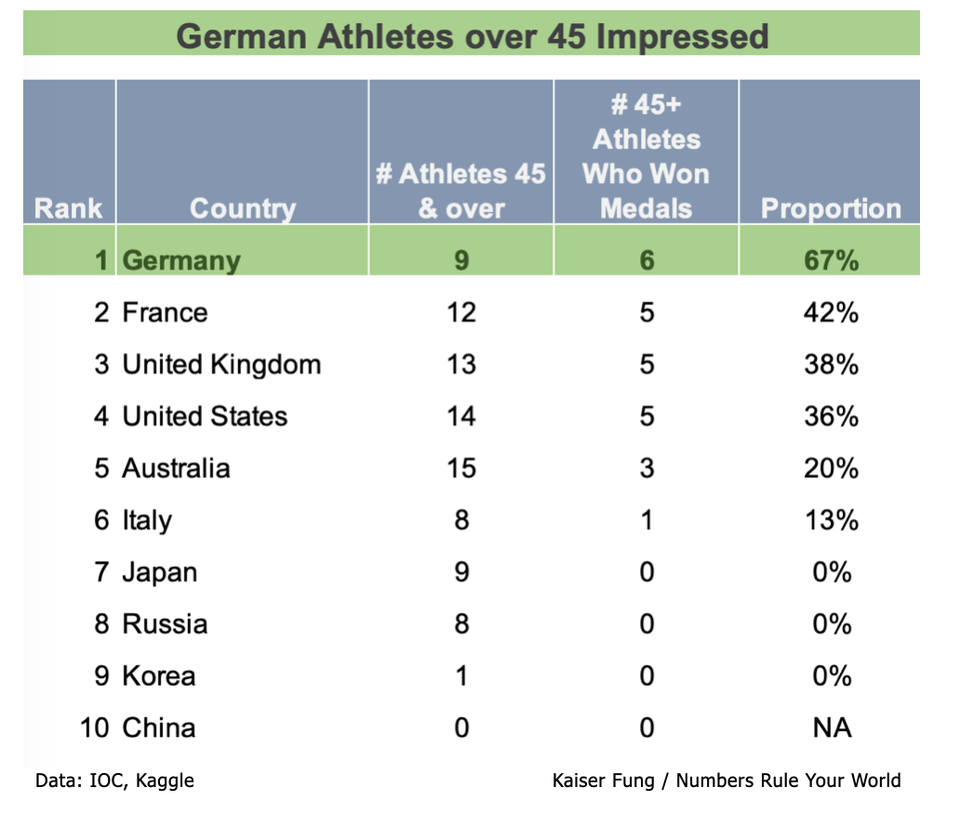
Big Data Demo of how data can tell any story you want, ode to Tokyo Kaiser completes a challenge: come up with ways to rank any country #1 in the Tokyo Olympics.
Assumptions Blood clots: is there a there Kaiser looks at the controversy over blood clots and the Astrazeneca vaccine.
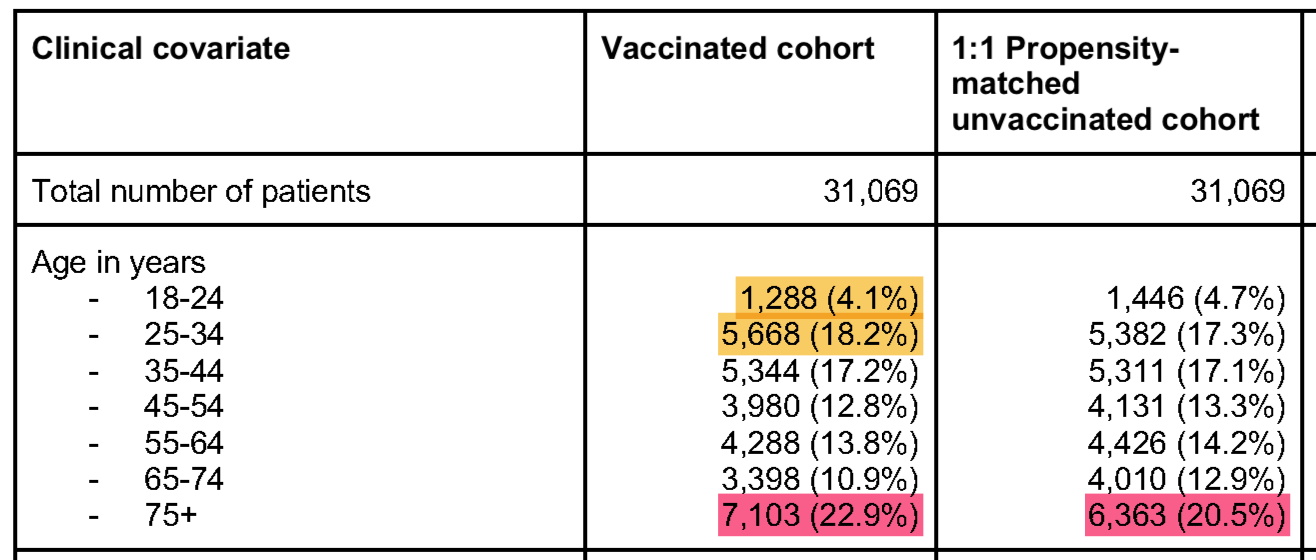
Cause-effect Real-world studies: limits of knowledge Kaiser focuses attention on a few aspects of the Mayo Clinic real-world effectiveness study.
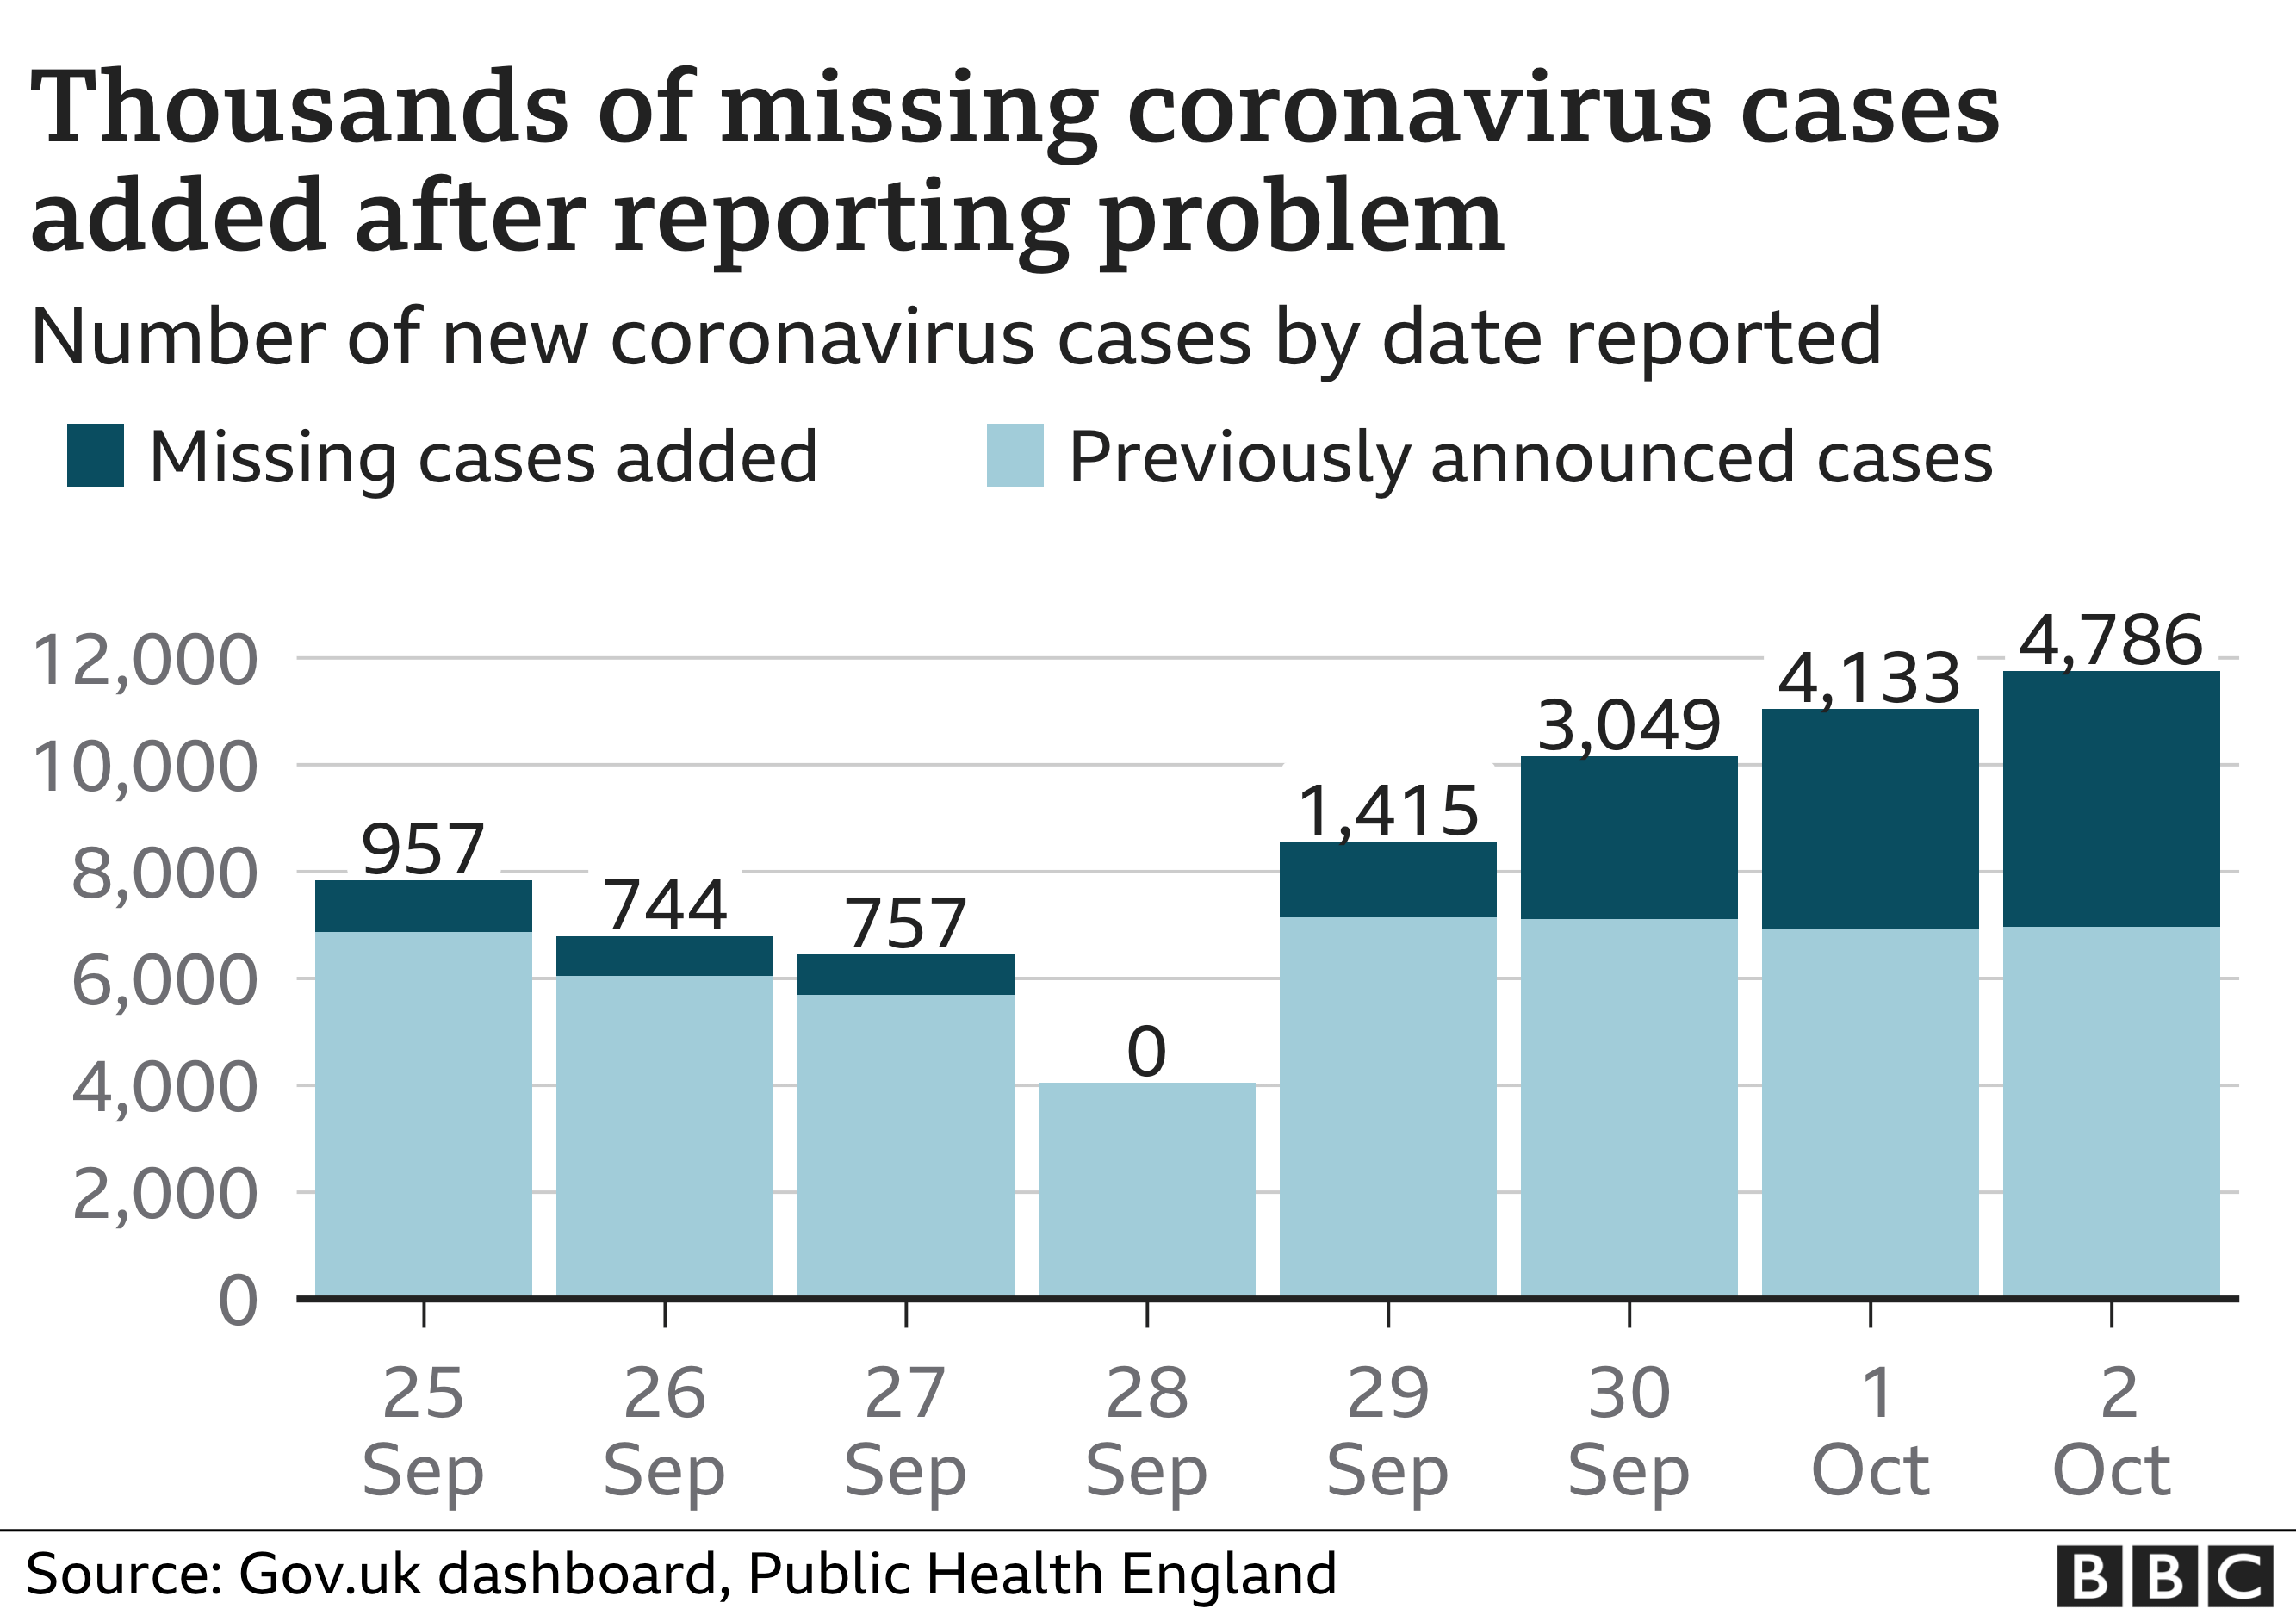
Excel Dr. Backlog jumps the pond Kaiser investigates the official reason for U.K. under-reporting of coronavirus cases.