Junk Charts
  • About
  • RSS
  • Posts by Year
  • Posts by Keywords
Sign in Subscribe

Data

How hard can counting be?
Analytics-business interaction

How hard can counting be?

How hard can counting be? Reflections on the jump in homeless in the US
Read More
Five-value summaries of distributions
Boxplot

Five-value summaries of distributions

Using five numbers ot summarize data distributions
Read More
What is this "stacked range chart"?
Aggregation

What is this "stacked range chart"?

Do we need this "stacked range chart"?
Read More
the wtf moment
Bar chart

the wtf moment

the wtf moment in dataviz
Read More
Contaminated science
Analytics-business interaction

Contaminated science

Did lab test results confirm onions as culprits of recent E.coli outbreak?
Read More
Election coverage prompts good graphics
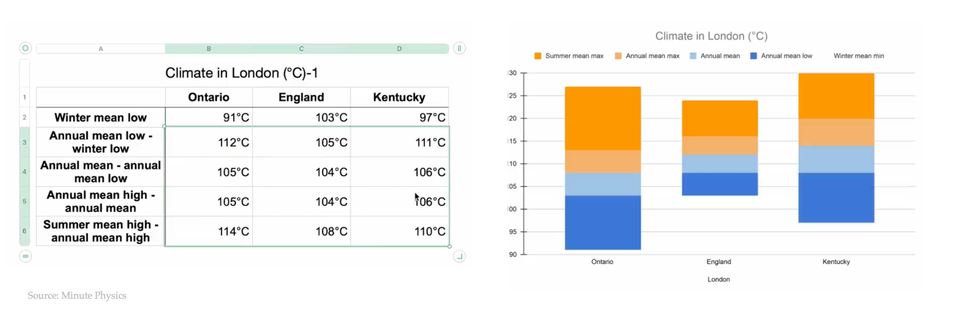
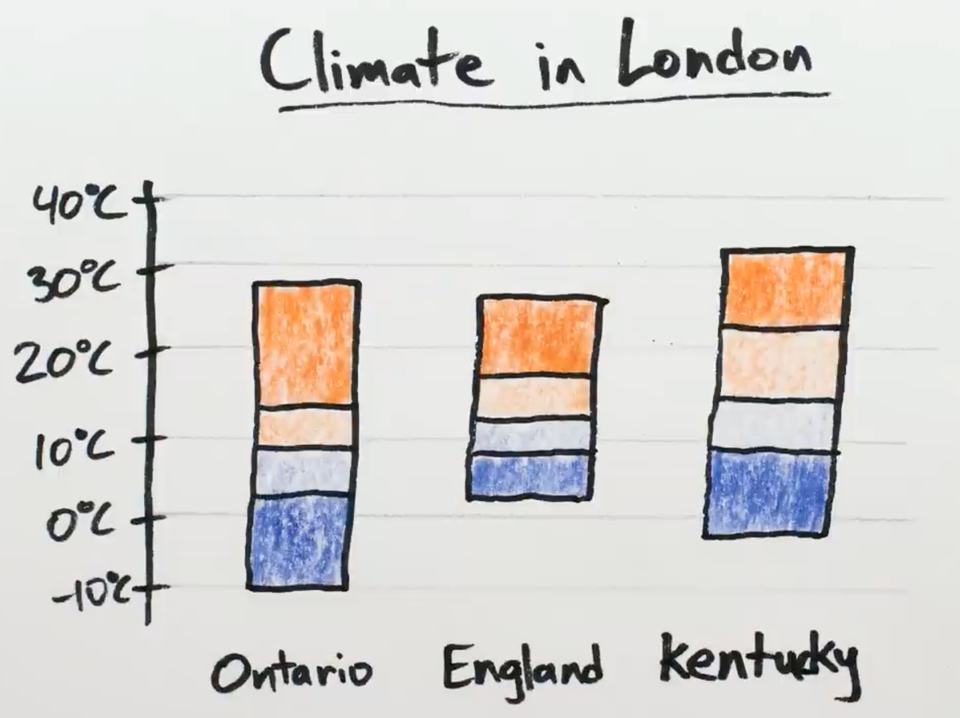
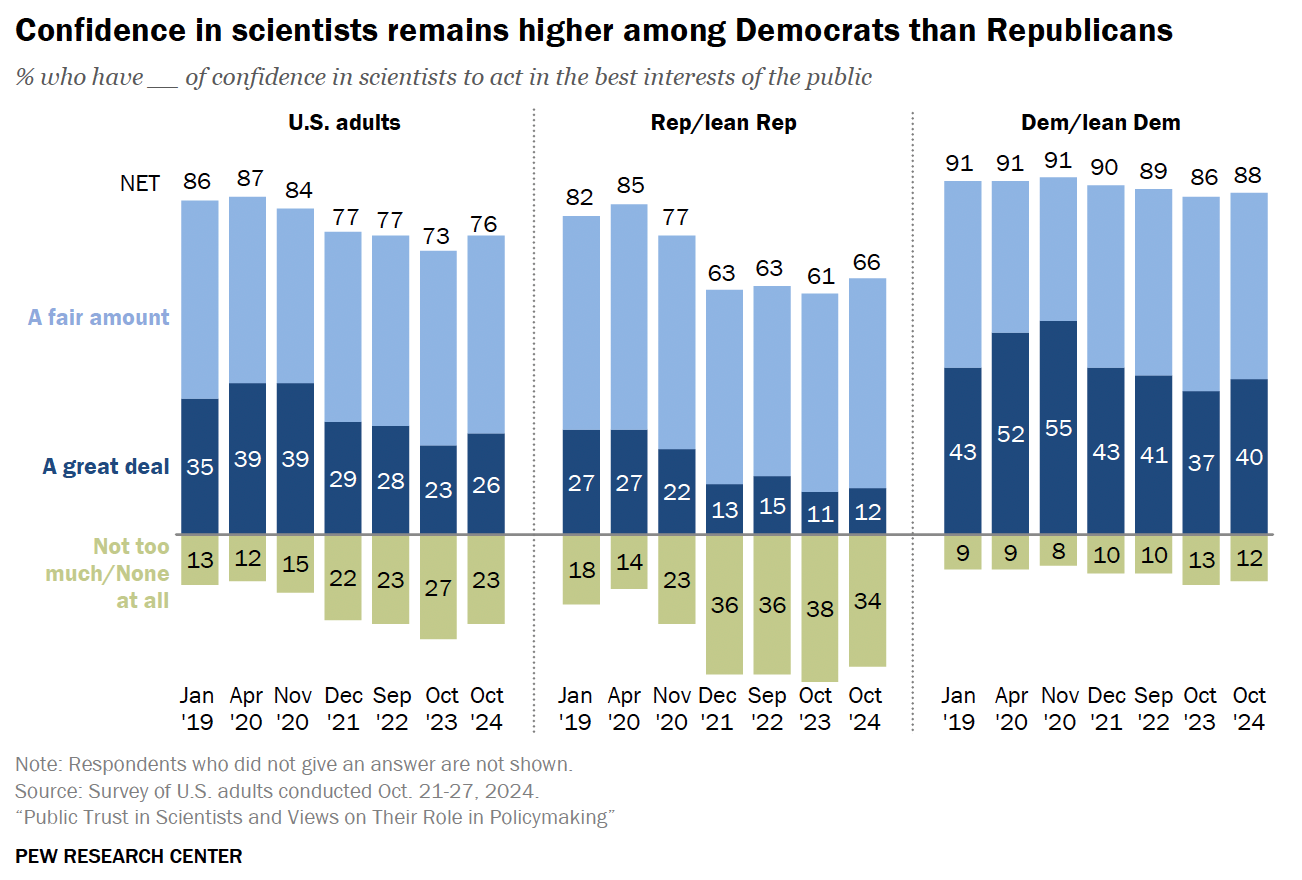
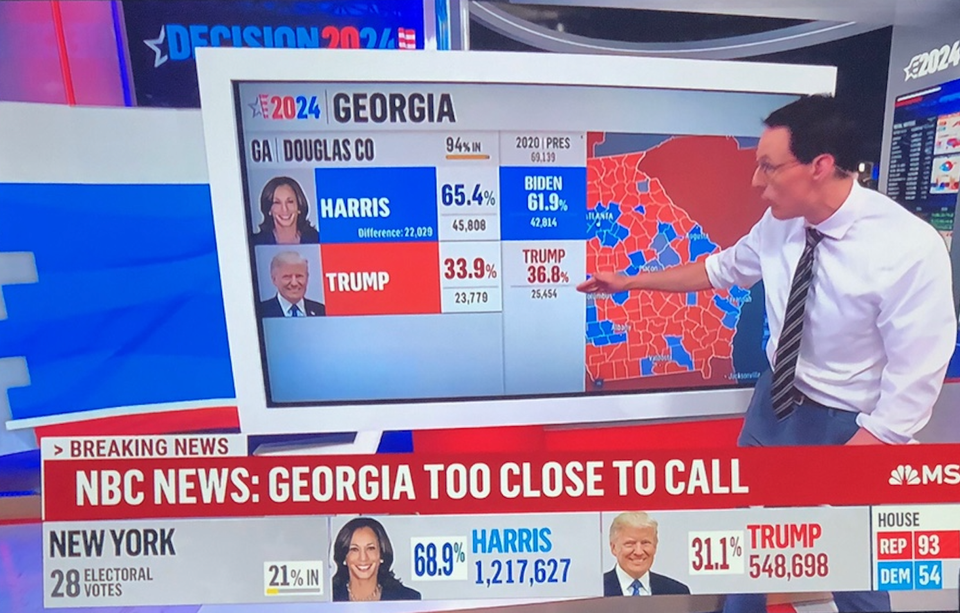
Aggregation

Election coverage prompts good graphics

Election coverage brings out the best of interactive graphics
Read More
← Newer Posts Page 5 of 20 Older Posts →
Junk Charts © 2025
  • BOOKS
  • COURSES
  • PRESS
  • CONSULTING
  • COACHING
  • CONTACT
Powered by Ghost