Junk Charts
About
RSS
Posts by Year
Posts by Keywords
Sign in
Subscribe
demographics
Sorting
The greatest nations on earth
How you compare to others
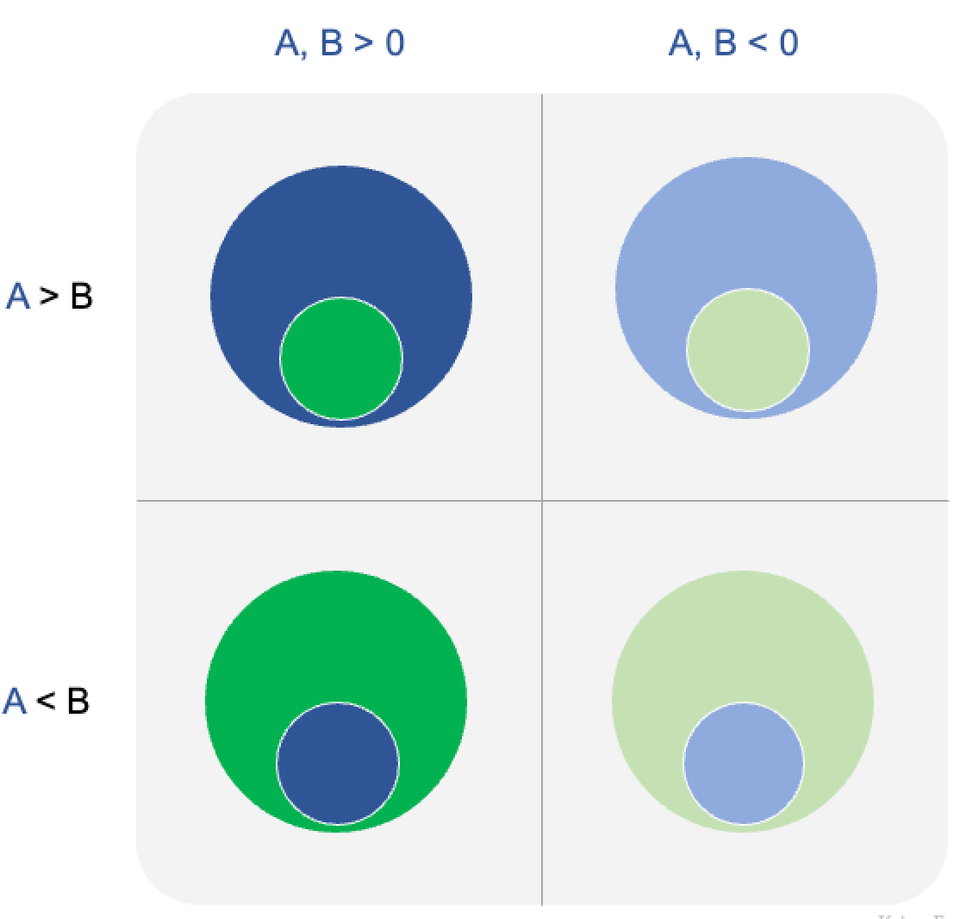
Bubble chart
Guide to using pairs of circles
A discussion of some design decisions
data visualization
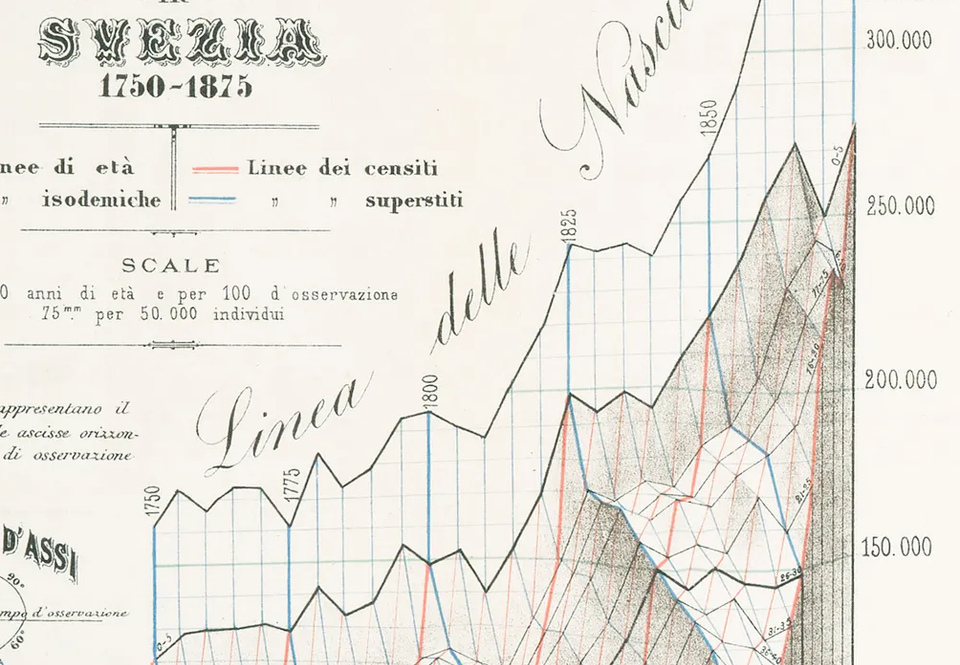
Beautiful chart to behold
Data visualization circa 1880 from Italy
demographics
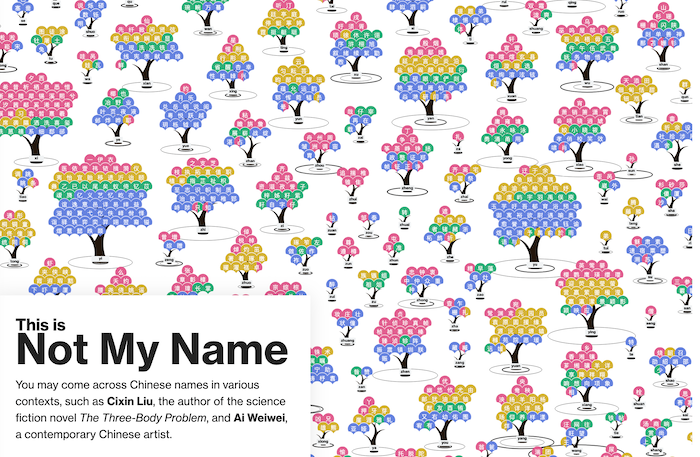
Say Jon without the h in Chinese
Unraveling the Chinese name puzzle
Dot plot
Out of line
Out of line
Assumptions
Causal skimming
Weathly people are moving downtown, says WSJ
Page 1 of 2
Older Posts
→