Junk Charts
About
RSS
Posts by Year
Posts by Keywords
Sign in
Subscribe
Economics
Aggregation
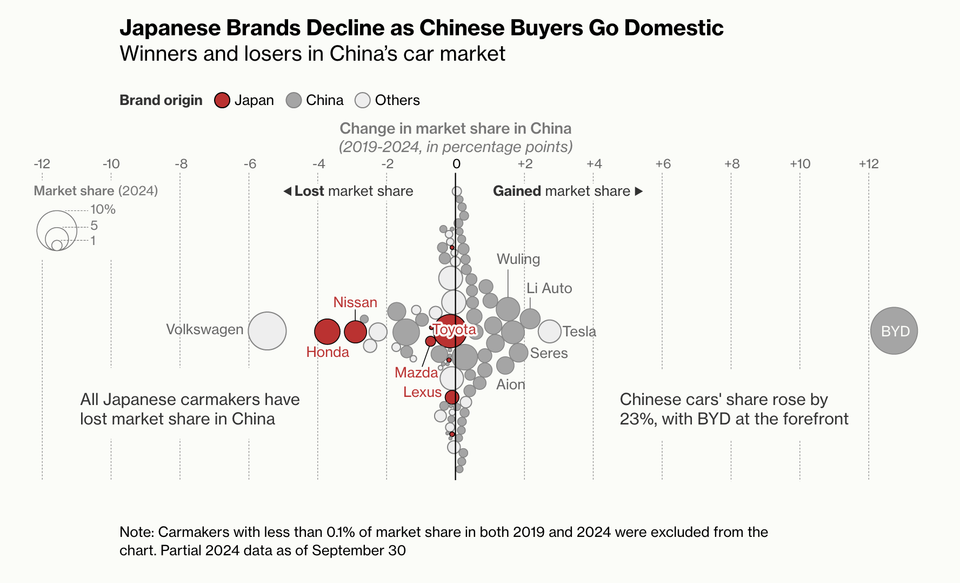
Dot plots with varying dot sizes
An example of a dot plot with varying dot sizes
Bar chart
Tidying up the details
Fixing up little details on a data graphic pays dividends
Bar chart
Making colors and groups come alive
How to use color effectively in a dataviz
Business
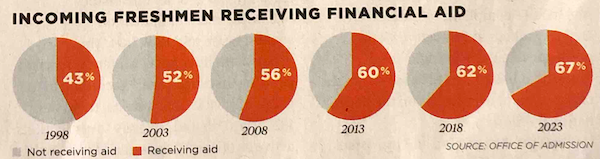
Pie charts and self-sufficiency
A series of pie charts is used to demonstrate a trend
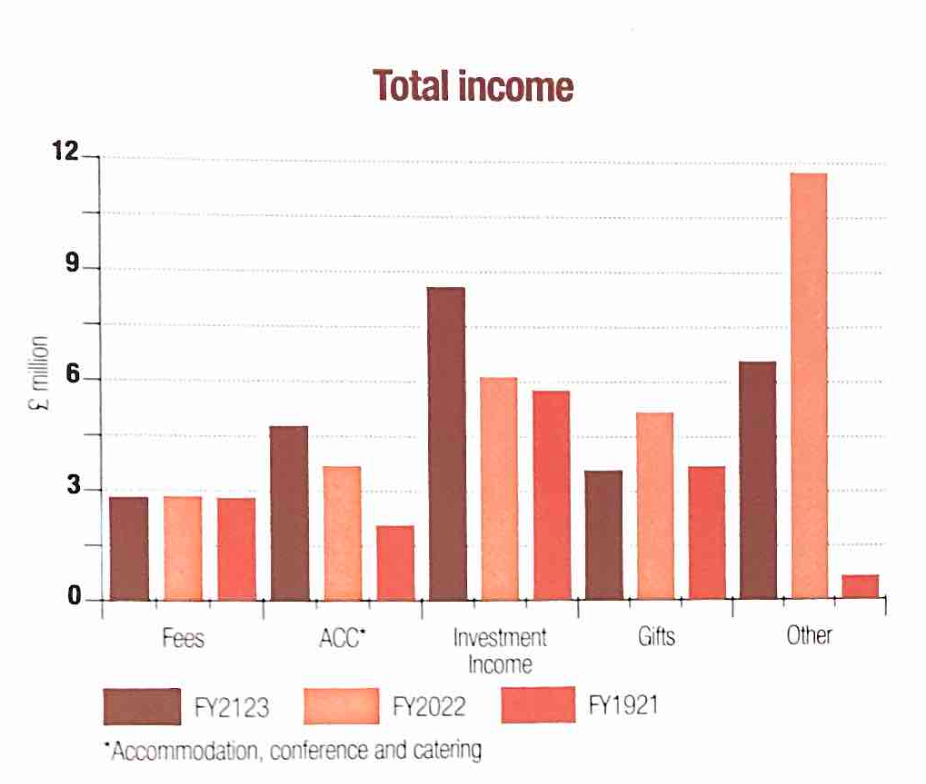
Bar chart
When should we use bar charts?
Kaiser looks at two column charts.
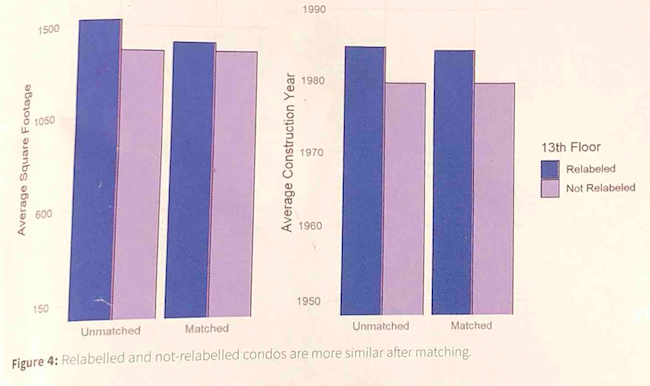
Bar chart
Is this dataviz?
Kaiser looks for the data behind this pie chart.
←
Newer Posts
Page 5 of 19
Older Posts
→