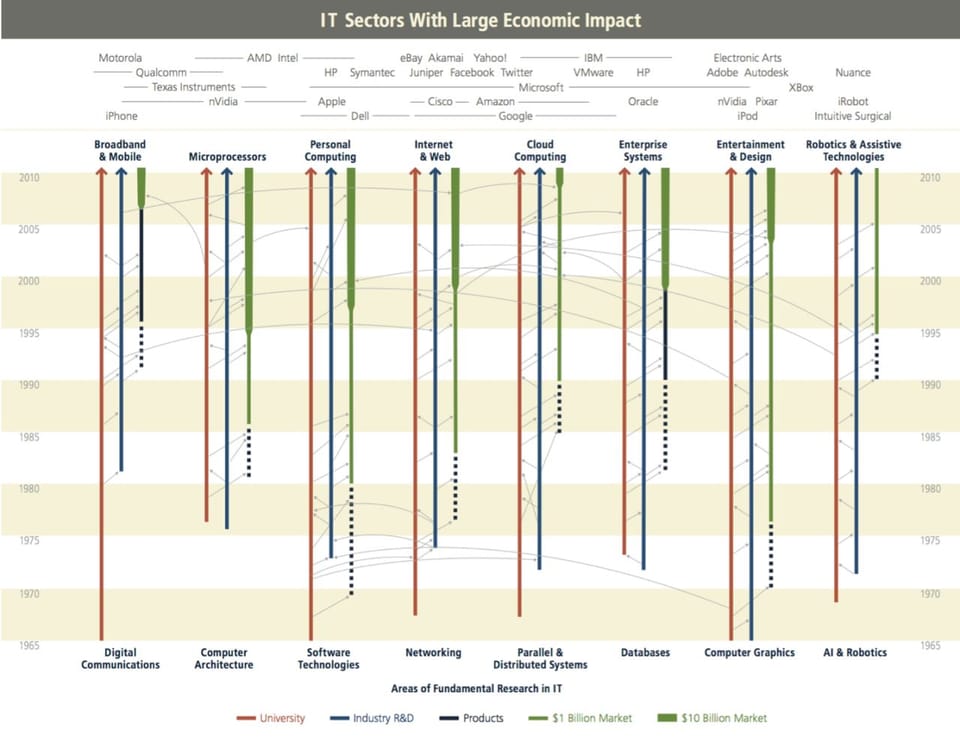
Junk Charts
  • About
  • RSS
  • Posts by Year
  • Posts by Keywords
Sign in Subscribe

Education

Analytics-business interaction

An example of terrible analytics report design

In the business analytics universe, the discipline of "business intelligence"
Read More
Exquisite chart by-of-for academics
Aggregation

Exquisite chart by-of-for academics

This chart published in Harvard Magazine has won my heart. It is
Read More
How effective visualization brings data alive
Aggregation

How effective visualization brings data alive

Bringing data alive
Read More
Take back the GPA
Blogs

Take back the GPA

Princeton - apparently due to pressure from parents - is on the
Read More
Nothing to see here
Blogs

Nothing to see here

Some graphics are made to inform, some to amuse, some to delight.
Read More
Education

Announcement: Dataviz Workshop for Spring 2014

I'm very excited to preview the syllabus of a new
Read More
← Newer Posts Page 2 of 6 Older Posts →
Junk Charts © 2025
  • BOOKS
  • COURSES
  • PRESS
  • CONSULTING
  • COACHING
  • CONTACT
Powered by Ghost