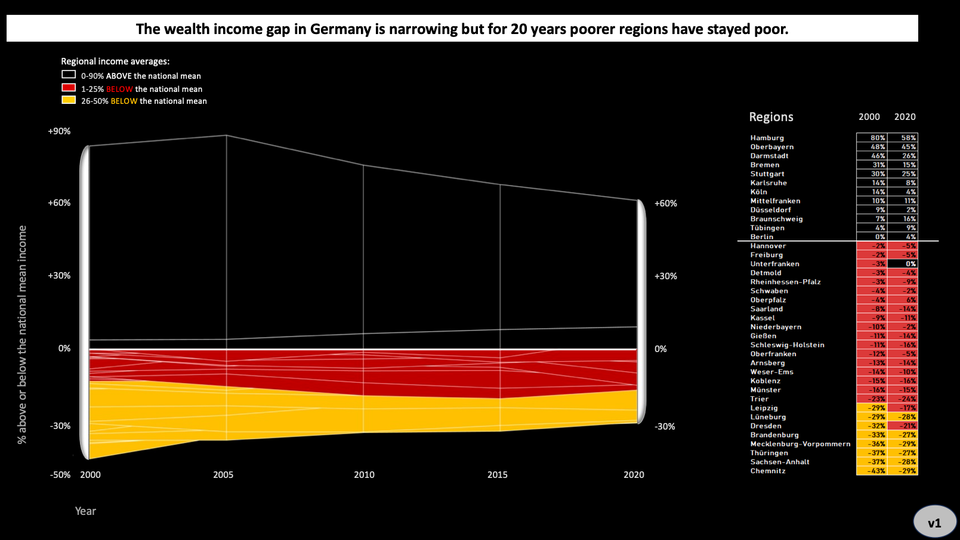
ray vella Aligning the visual and the message Student of Ray Vella's NYU class produces a delightful project
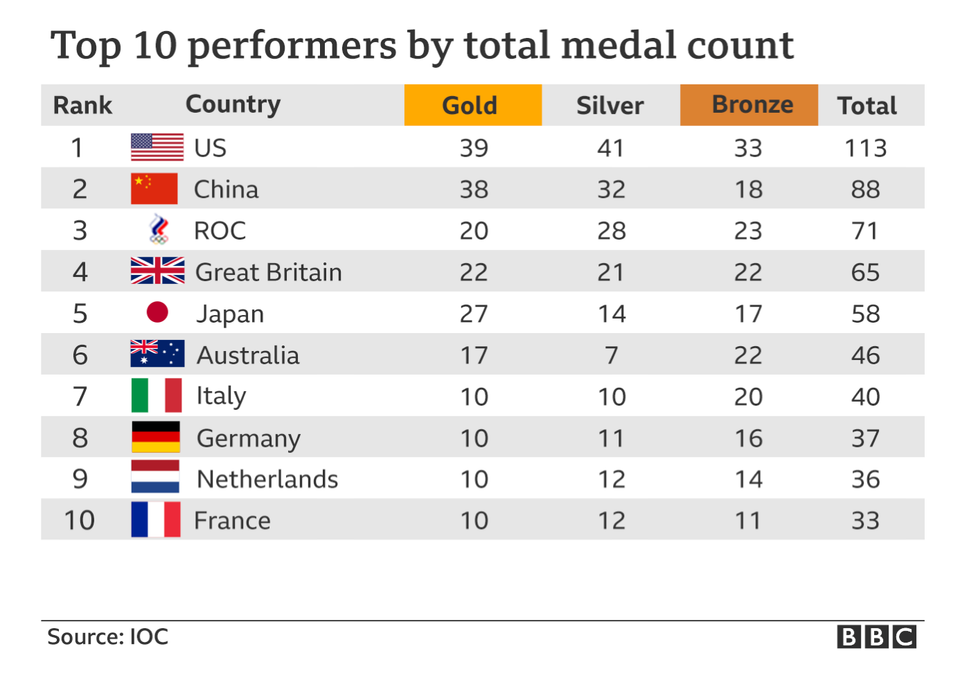
Big Data Round 2: 10 Ways to Rank the Rio Summer Olympics Kaiser finds another set of 10 metrics that can be used to rank any country top of the medals table.
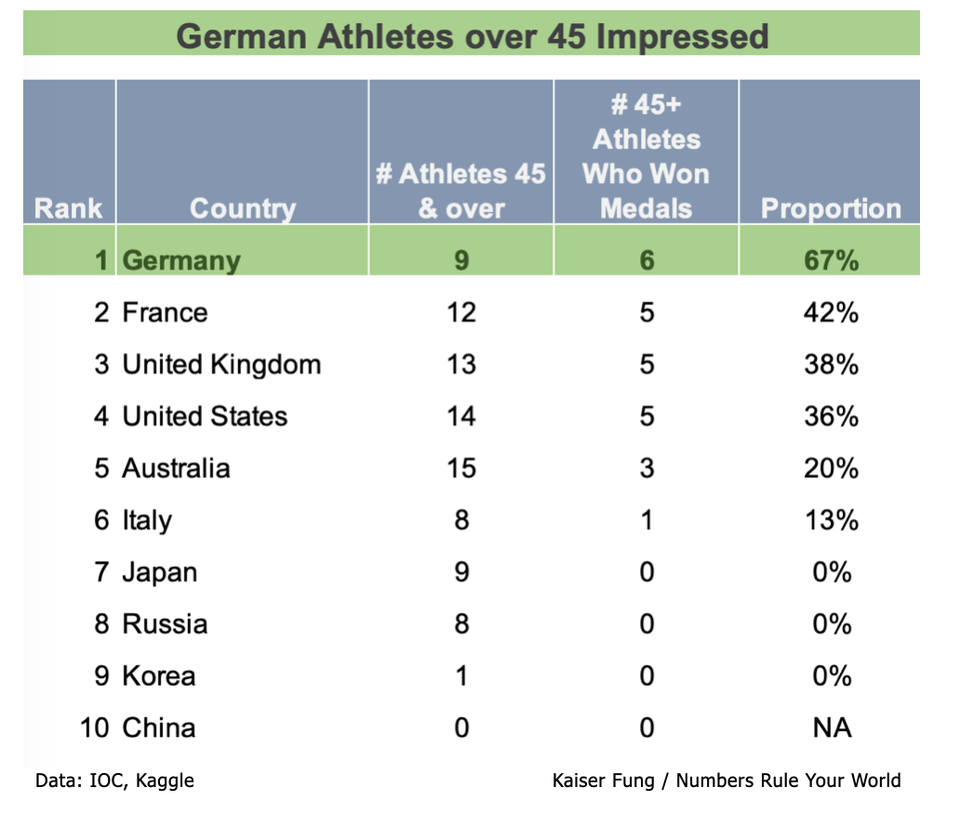
Big Data Demo of how data can tell any story you want, ode to Tokyo Kaiser completes a challenge: come up with ways to rank any country #1 in the Tokyo Olympics.