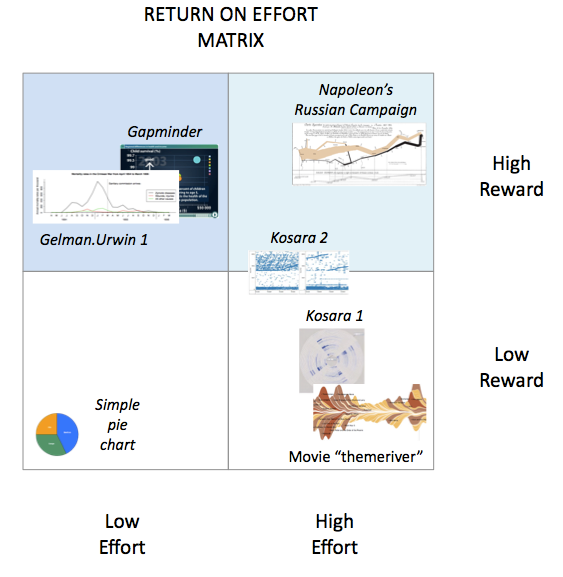
Junk Charts
  • About
  • RSS
  • Posts by Year
  • Posts by Keywords
Sign in Subscribe

Interactive

A graphlick showing mortgage prices
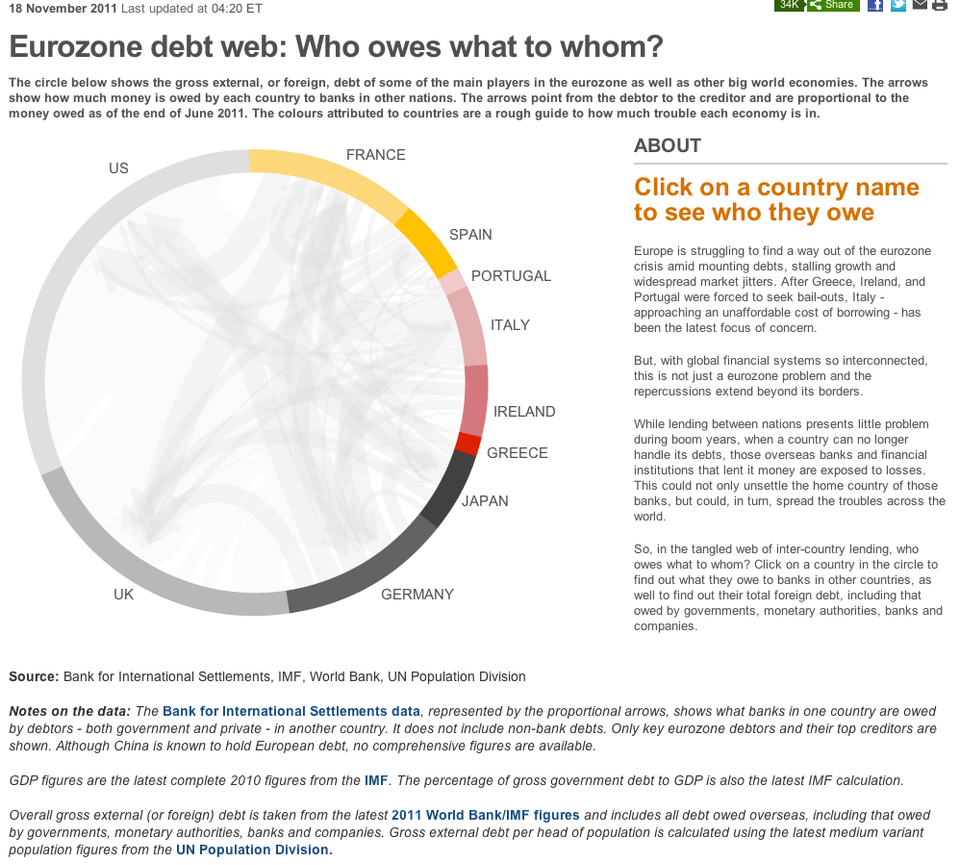
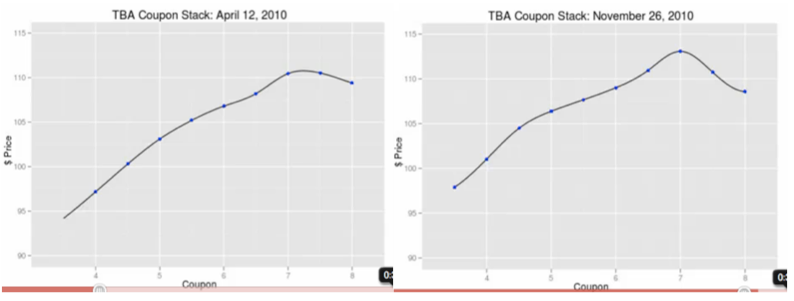
Business

A graphlick showing mortgage prices

The work of Hans Rosling and Gapminder (now part of Google) highlighted
Read More
Different pictures of unemployment
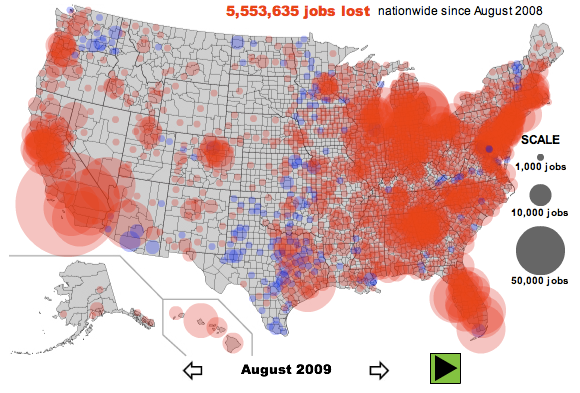
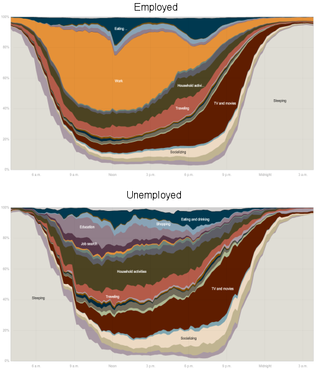
Aggregation

Different pictures of unemployment

Unemployment and job losses being such a worrying social problem in the
Read More
Energy- and search-efficient
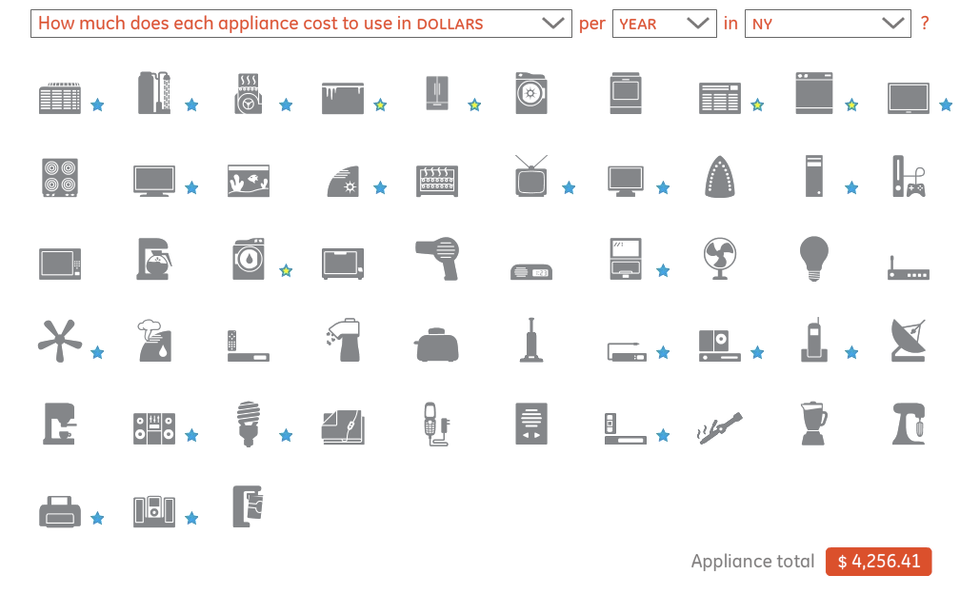
Clustering

Energy- and search-efficient

At our recent NYU talk, Dona Wong presented a graphic that her
Read More
Degrees of likeness 2
Aggregation

Degrees of likeness 2

We left off the other day with an interactive graphic with the
Read More
Visual analogies
Axis

Visual analogies

Many a startling faux pas in graphics start with the desire to
Read More
How to read a graph
Blogs

How to read a graph

Via Gelman, here is a nifty book-buying map from Amazon, displaying the
Read More
← Newer Posts Page 3 of 4 Older Posts →
Junk Charts © 2026
  • BOOKS
  • COURSES
  • PRESS
  • CONSULTING
  • COACHING
  • CONTACT
Powered by Ghost