Current affairs Approaching the Paris Olympics SCMP impresses again with this infographics about the Paris Olympics
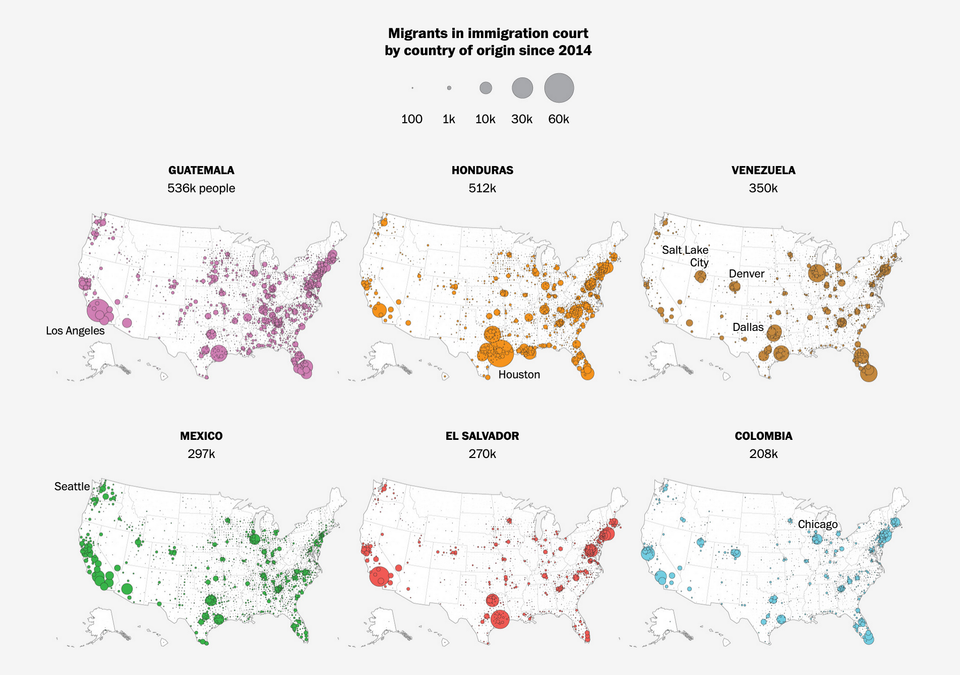
Current affairs Expert handling of multiple dimensions of data Kaiser enjoys a set of maps about American immigration.