Junk Charts
  • About
  • RSS
  • Posts by Year
  • Posts by Keywords
Sign in Subscribe

junkcharts

Visualizing extremes
Aggregation

Visualizing extremes

Nice NYT chart showing weather extremes
Read More
Aligning the visual and the message to hot things up
Color

Aligning the visual and the message to hot things up

How hot is Phoenix
Read More
Small tweaks that make big differences
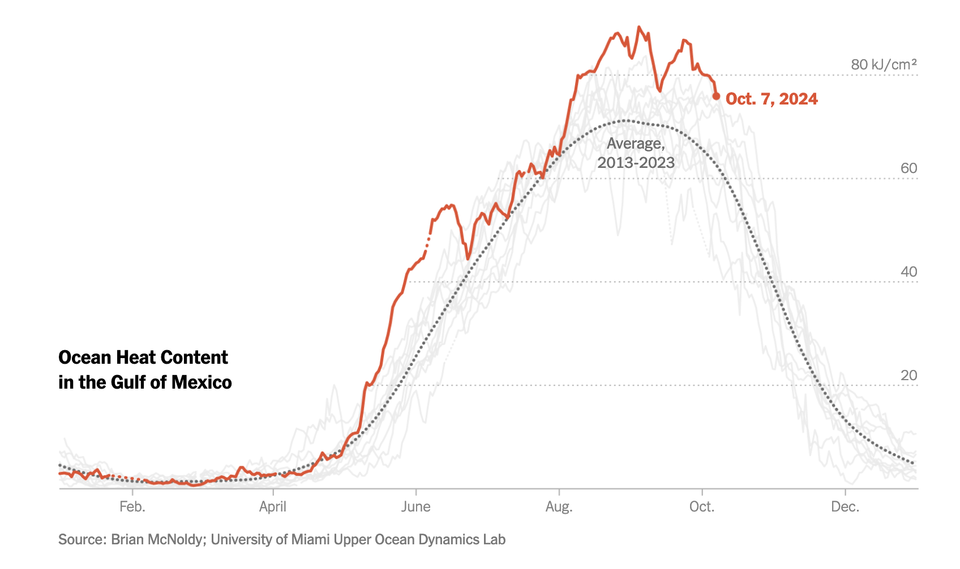
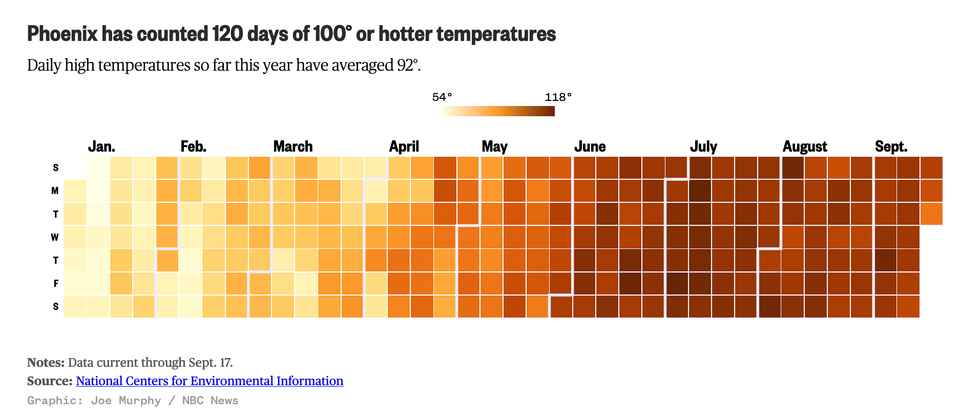
Axis

Small tweaks that make big differences

Some small tweaks to data graphics make a huge difference
Read More
Tidying up the details
Bar chart

Tidying up the details

Fixing up little details on a data graphic pays dividends
Read More
Using disaggregation in dataviz
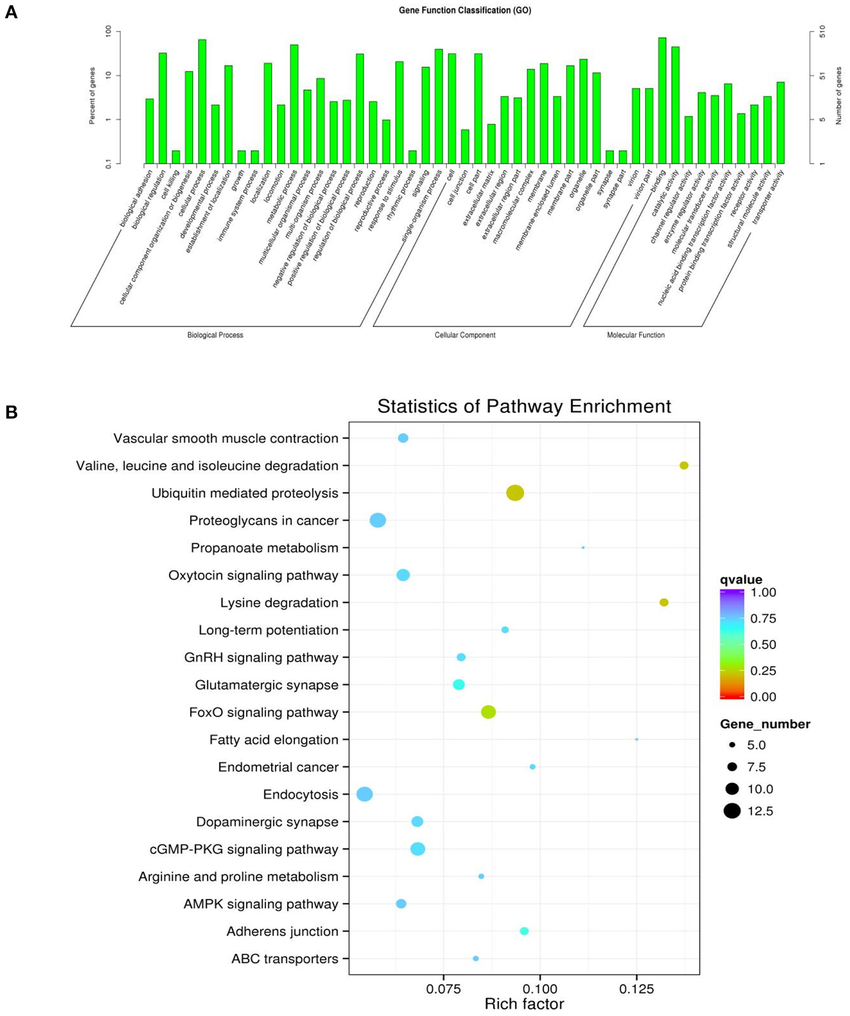
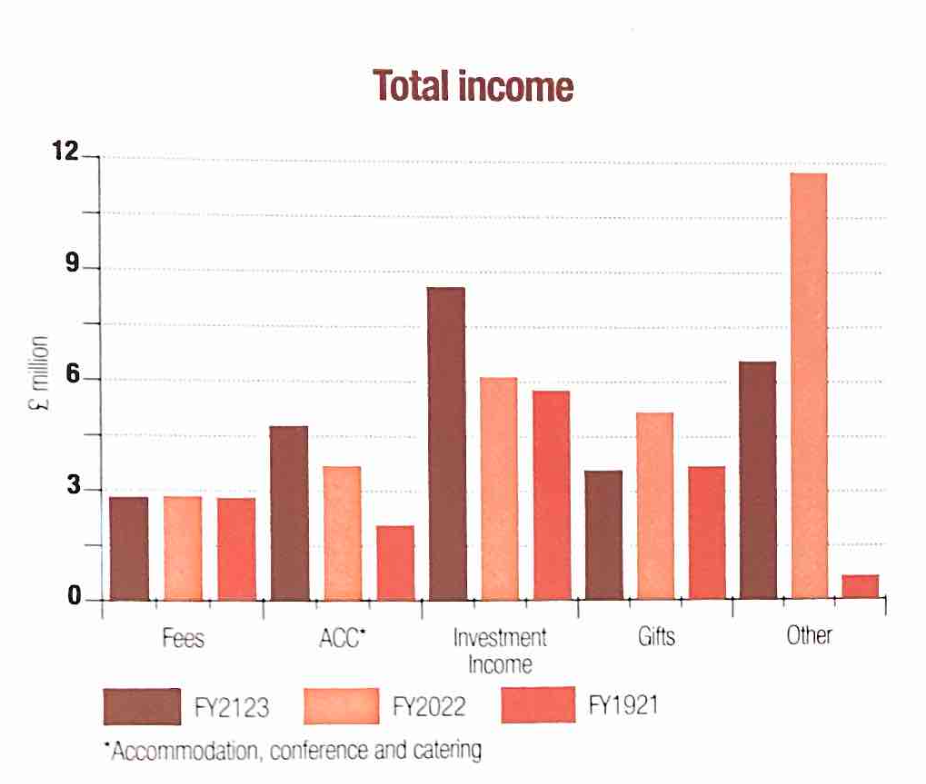
Aggregation

Using disaggregation in dataviz

Disaggregating data can be very useful when making charts
Read More
The most dangerous day
Aggregation

The most dangerous day

The most dangerous day in one's life
Read More
← Newer Posts Page 14 of 63 Older Posts →
Junk Charts © 2026
  • BOOKS
  • COURSES
  • PRESS
  • CONSULTING
  • COACHING
  • CONTACT
Powered by Ghost