Junk Charts
  • About
  • RSS
  • Posts by Year
  • Posts by Keywords
Sign in Subscribe

line chart

Another test of self-sufficiency
self-sufficiency test

Another test of self-sufficiency

Reading an infographic of Swiss elections
Read More
Beautiful chart to behold
data visualization

Beautiful chart to behold

Data visualization circa 1880 from Italy
Read More
Forced roommates, favoritism, and more in data visualization
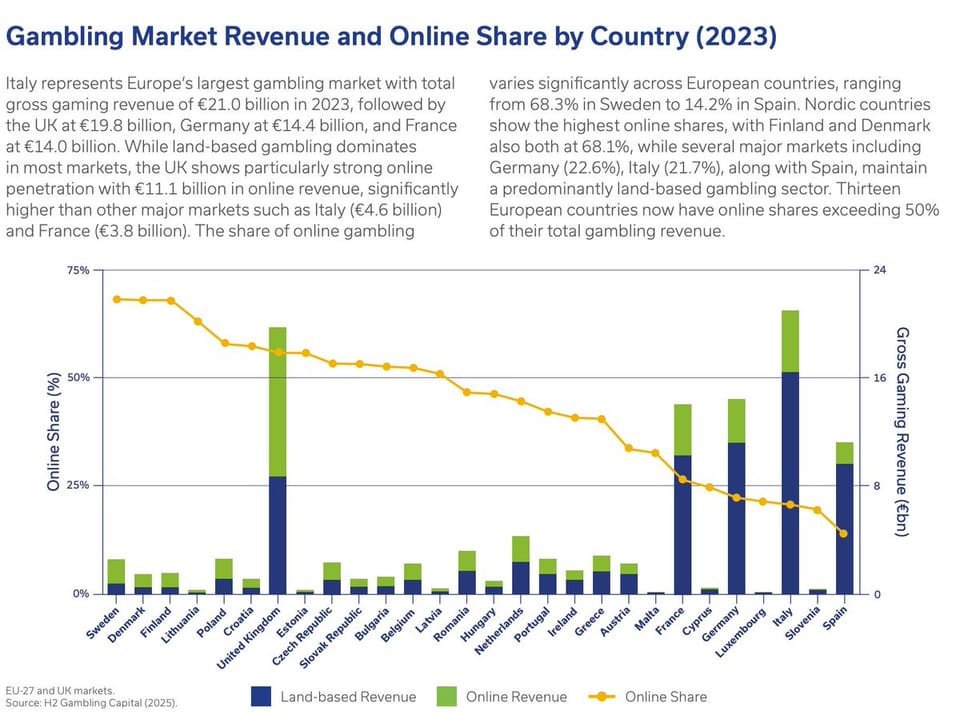
dual axes

Forced roommates, favoritism, and more in data visualization

Why is this dual-axes chart so taxing to read?
Read More
The story on international students coming to the U.S.
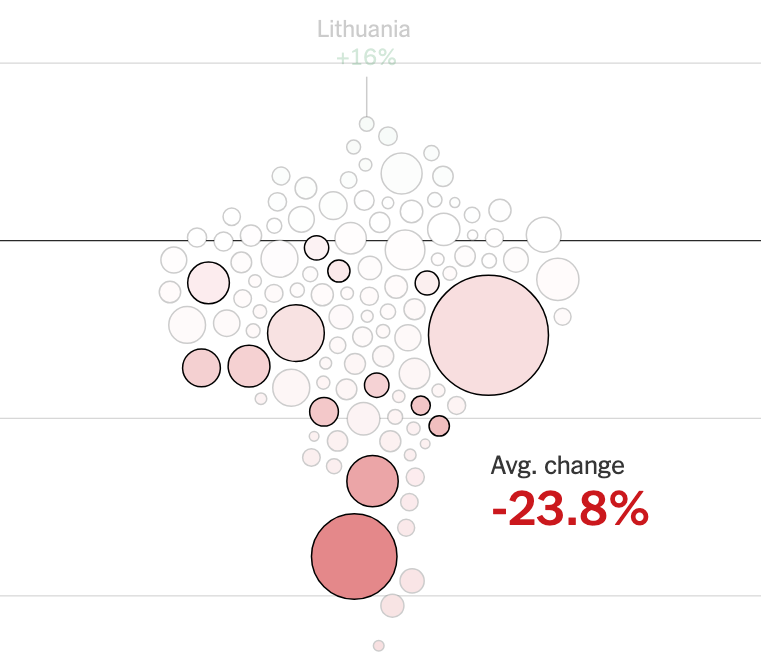
visual storytelling

The story on international students coming to the U.S.

How to visualize complex datasets
Read More
Big drops and big dots
line chart

Big drops and big dots

Droppings at BLS
Read More
Peak social media? Depends on how you measure it
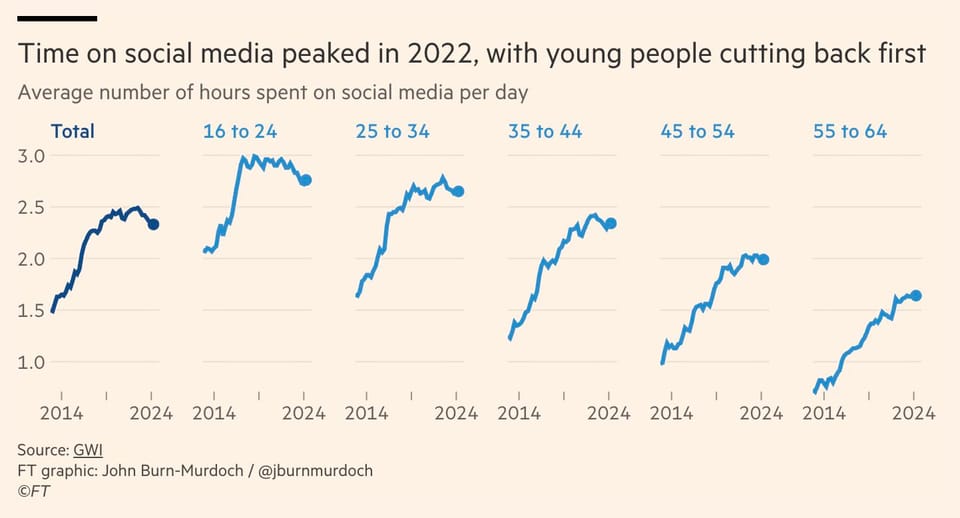
cohort

Peak social media? Depends on how you measure it

Separating individual and group effects over time
Read More
Page 1 of 17 Older Posts →
Junk Charts © 2026
  • BOOKS
  • COURSES
  • PRESS
  • CONSULTING
  • COACHING
  • CONTACT
Powered by Ghost