Junk Charts
  • About
  • RSS
  • Posts by Year
  • Posts by Keywords
Sign in Subscribe

Map

Prime visual story-telling
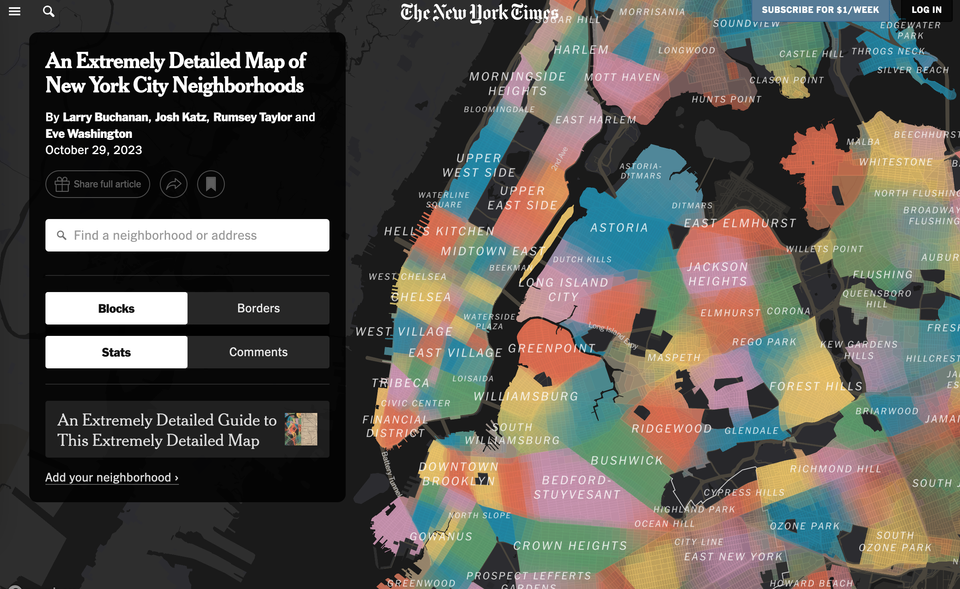
Clustering

Prime visual story-telling

Kaiser appreciates this wonderful example of visual storytelling.
Read More
The curse of dimensions
Aggregation

The curse of dimensions

Kaiser considers some bubble maps.
Read More
Do you want a taste of the new hurricane cone?
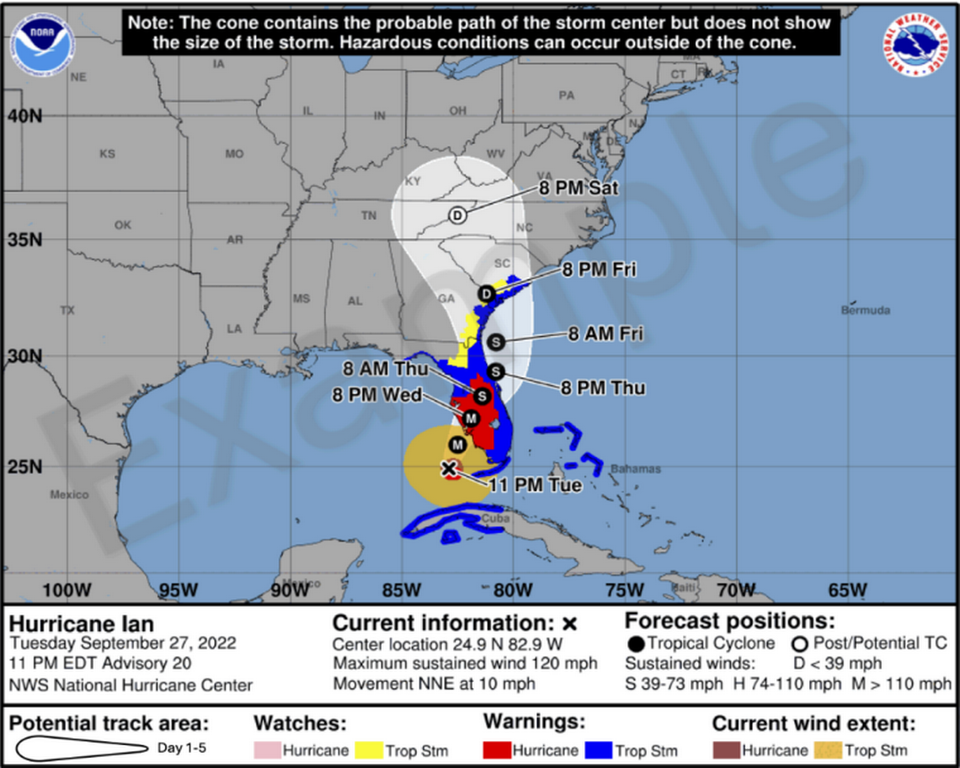
Aggregation

Do you want a taste of the new hurricane cone?

The National Hurricane Center (NHC) put out a press release (link to
Read More
Messing with expectations
Map

Messing with expectations

Kaiser reads a map of gas surcharges.
Read More
To a new year of pleasant surprises
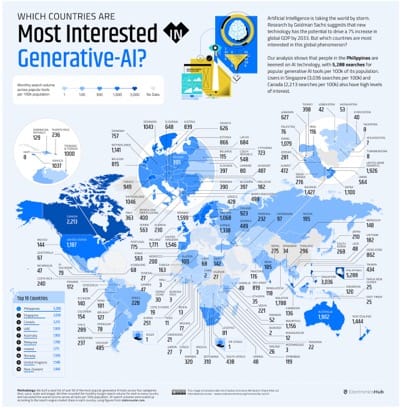
Business

To a new year of pleasant surprises

Kaiser finds a noisy map of the AI space. Happy new year!
Read More
To explain or to eliminate, that is the question
ray vella

To explain or to eliminate, that is the question

Reviewing some student projects
Read More
← Newer Posts Page 3 of 8 Older Posts →
Junk Charts © 2026
  • BOOKS
  • COURSES
  • PRESS
  • CONSULTING
  • COACHING
  • CONTACT
Powered by Ghost