Junk Charts
  • About
  • RSS
  • Posts by Year
  • Posts by Keywords
Sign in Subscribe

Map

Gaining precision by deleting data
Current affairs

Gaining precision by deleting data

How to gain precision by deleting data
Read More
Election coverage prompts good graphics
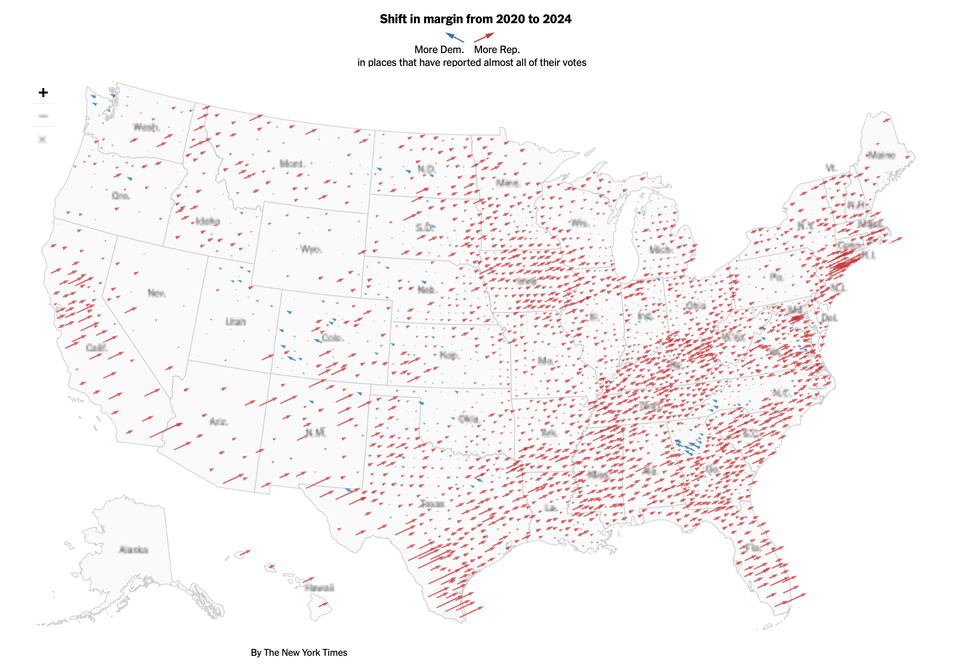
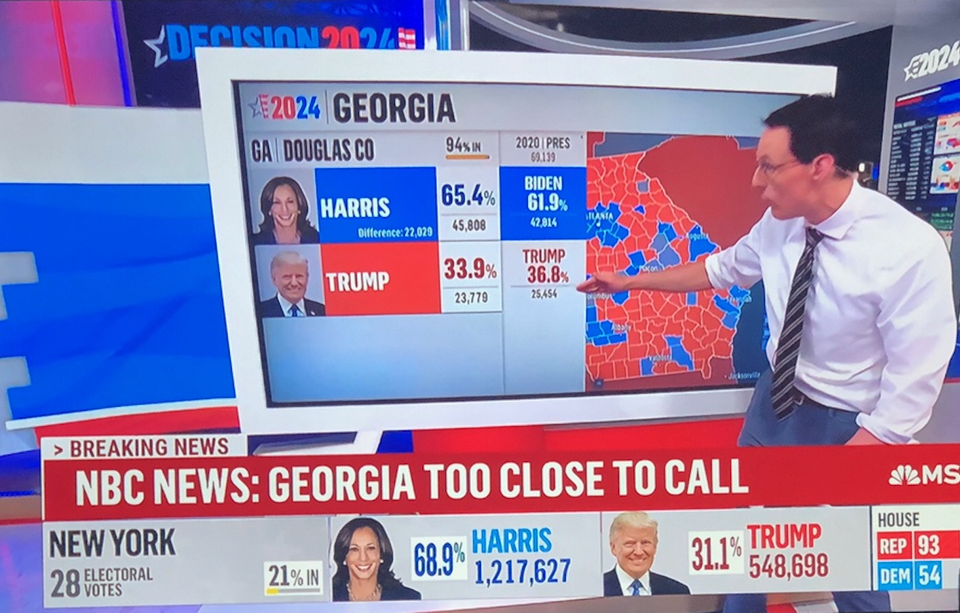
Aggregation

Election coverage prompts good graphics

Election coverage brings out the best of interactive graphics
Read More
Expert handling of multiple dimensions of data
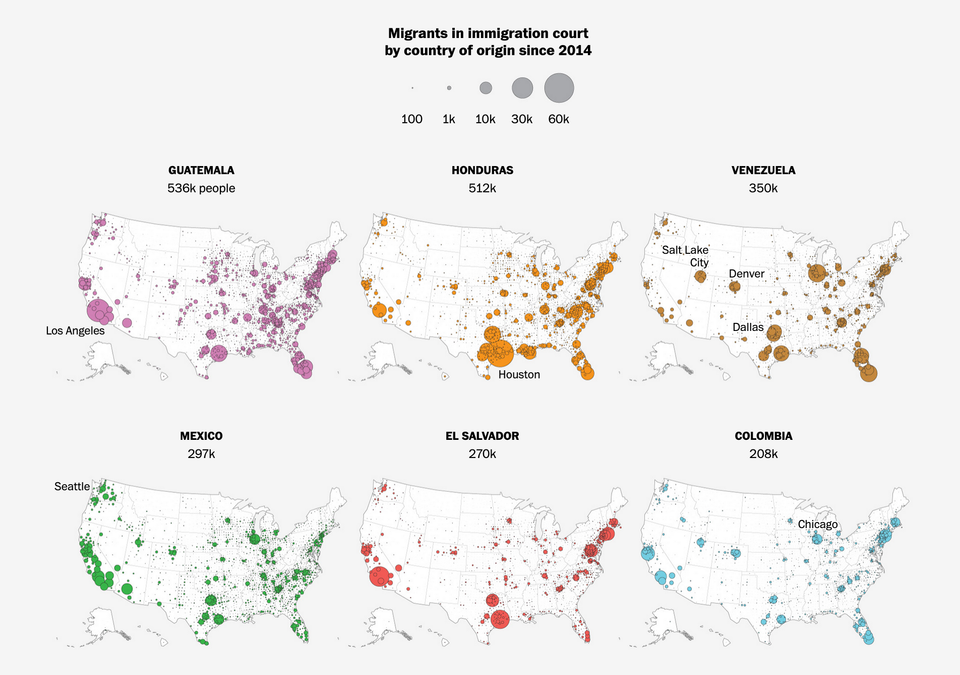
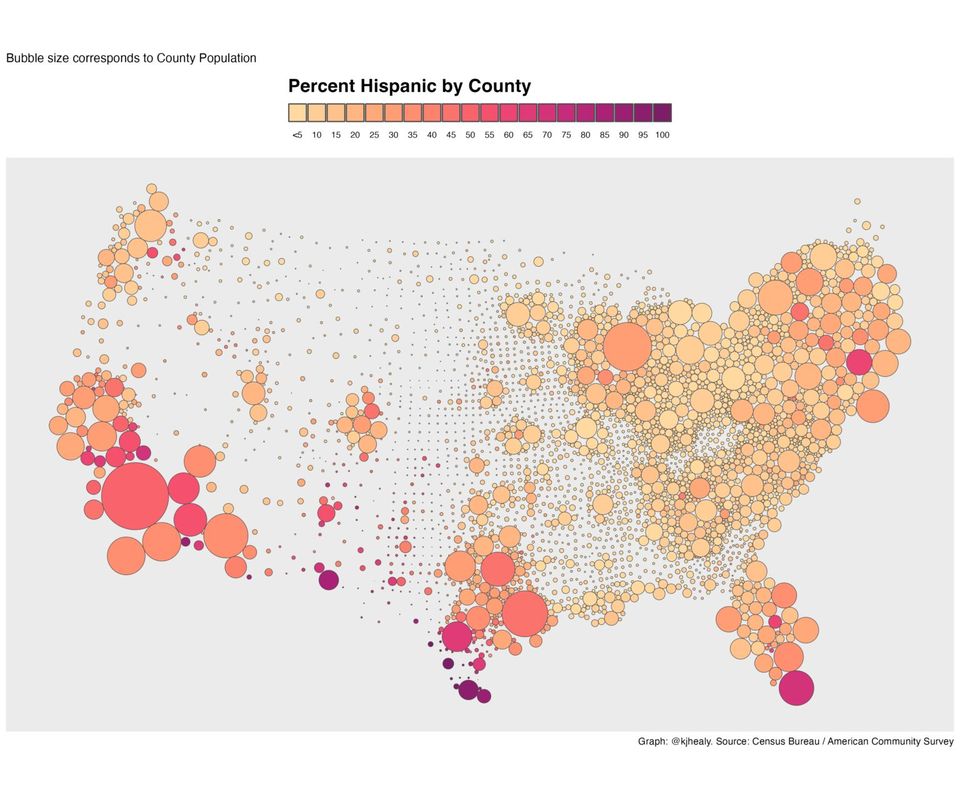
Current affairs

Expert handling of multiple dimensions of data

Kaiser enjoys a set of maps about American immigration.
Read More
Prime visual story-telling
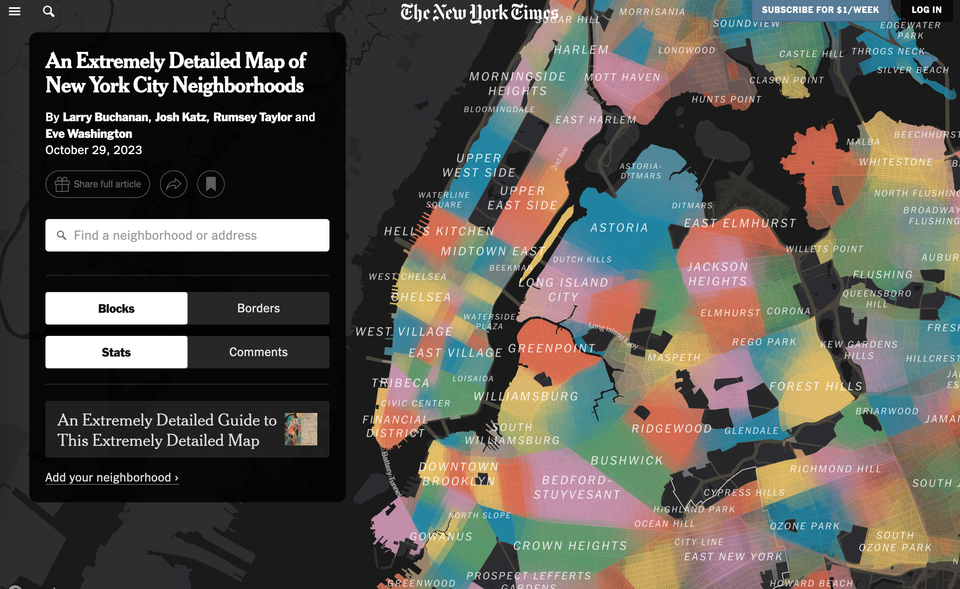
Clustering

Prime visual story-telling

Kaiser appreciates this wonderful example of visual storytelling.
Read More
The curse of dimensions
Aggregation

The curse of dimensions

Kaiser considers some bubble maps.
Read More
Do you want a taste of the new hurricane cone?
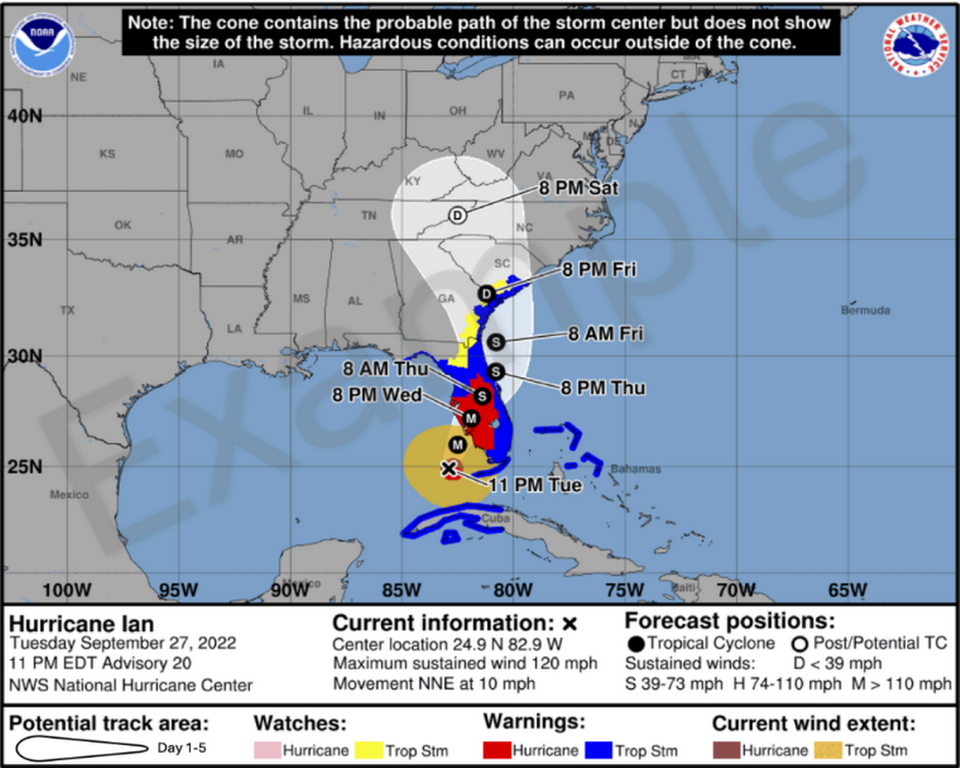
Aggregation

Do you want a taste of the new hurricane cone?

The National Hurricane Center (NHC) put out a press release (link to
Read More
← Newer Posts Page 3 of 8 Older Posts →
Junk Charts © 2026
  • BOOKS
  • COURSES
  • PRESS
  • CONSULTING
  • COACHING
  • CONTACT
Powered by Ghost