Junk Charts
  • About
  • RSS
  • Posts by Year
  • Posts by Keywords
Sign in Subscribe

new york city

Prime visual story-telling
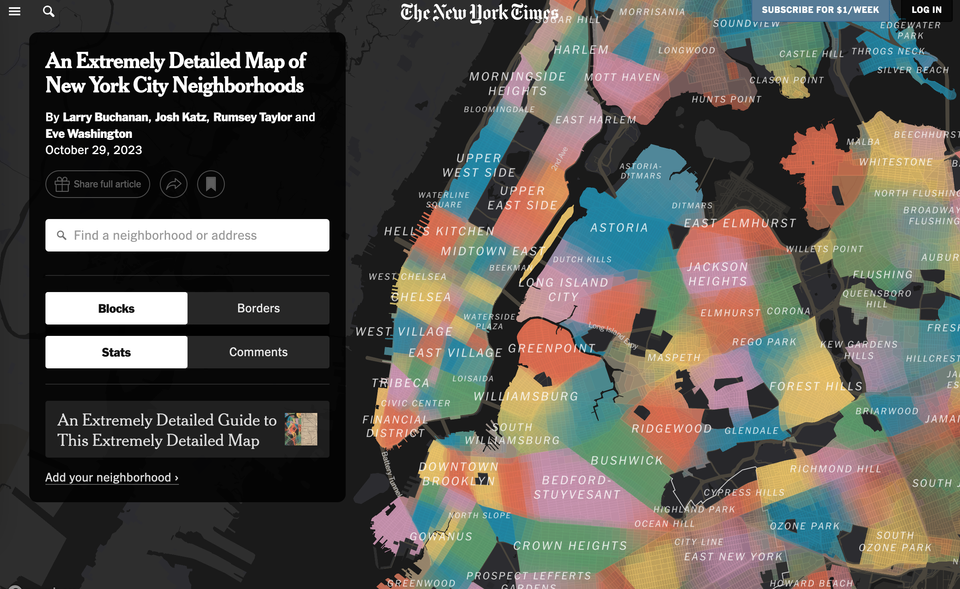
Clustering

Prime visual story-telling

Kaiser appreciates this wonderful example of visual storytelling.
Read More
Why you must know how analytical results were obtained
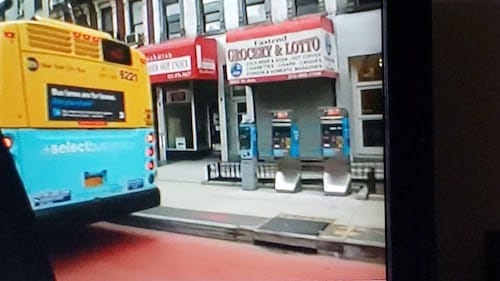
Analytics-business interaction

Why you must know how analytical results were obtained

Kaiser learns that MTA developed a 90% effective vaccine to cure fare evasion on city buses. They just need to go on CNN to sell this miracle.
Read More
Making charts beautiful without adding unneeded bits
streamgraph

Making charts beautiful without adding unneeded bits

What is the message?
Read More
← Newer Posts Page 2 of 2
Junk Charts © 2026
  • BOOKS
  • COURSES
  • PRESS
  • CONSULTING
  • COACHING
  • CONTACT
Powered by Ghost