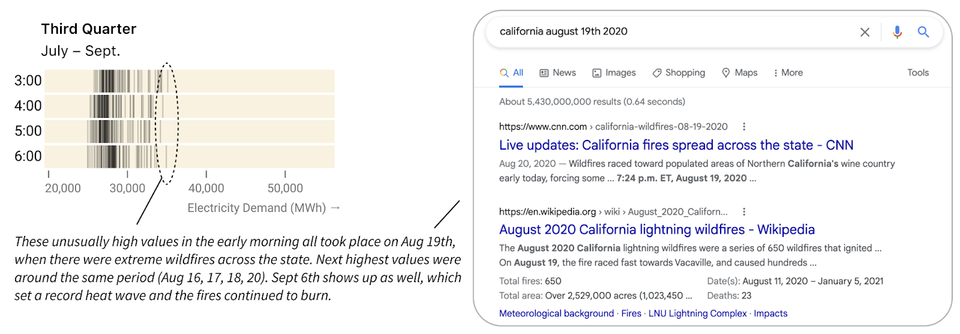
Aggregation The fun and frustration of seeking context Kaiser comments on the tricky business of introducing context to an exploratory data analysis.
Aggregation Digital revolution in China: two visual takes Kaiser Fung, founder of JunkCharts and Principal Analytics Prep, discusses a map in the Economist about the digital silk road in China. What's the story?
Food Foodies say, add dataviz spice please Kaiser Fung, founder of Junk Charts and Principal Analytics Prep, explains why the Venn diagram is not easy to read, and discusses some nice interesting food and beverage menus.
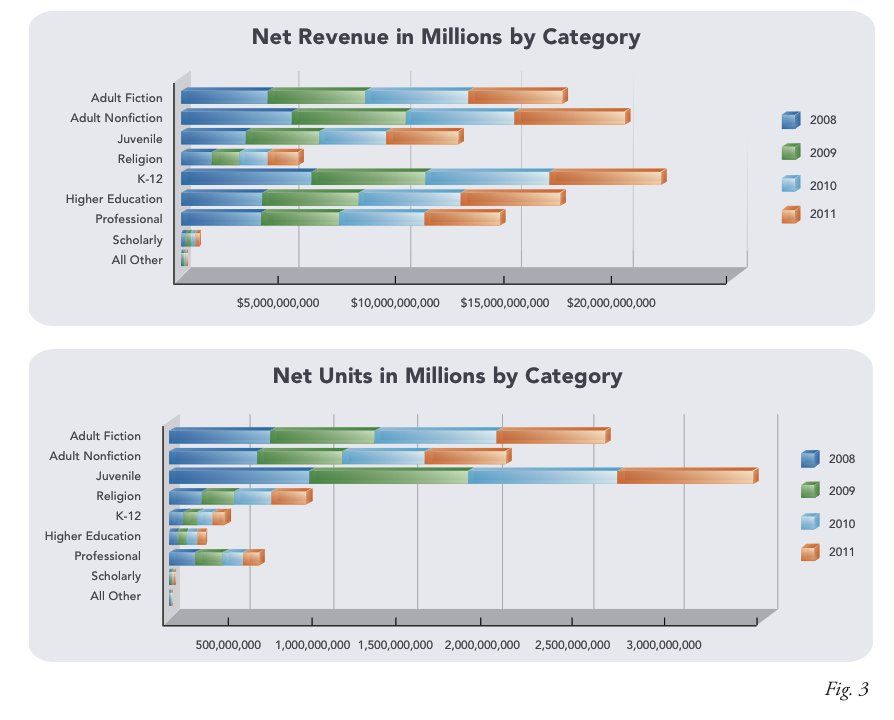
Aggregation It's your fault when you use defaults The following chart showed up on my Twitter feed last week. It&