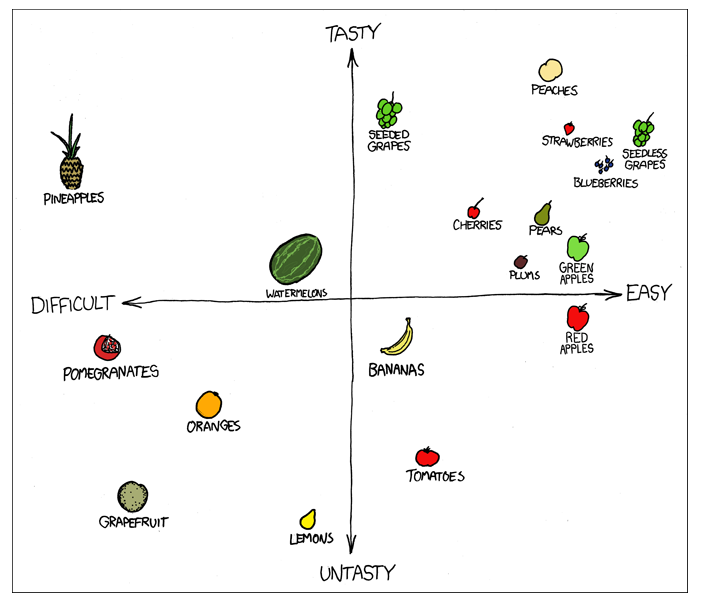
Junk Charts
  • About
  • RSS
  • Posts by Year
  • Posts by Keywords
Sign in Subscribe

Scatter plot

Visualizing web statistics
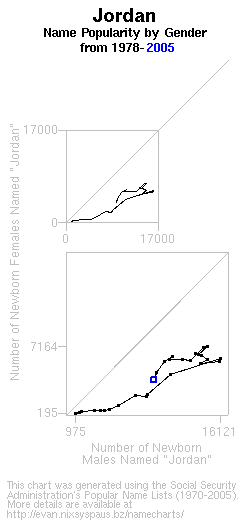
Aggregation

Visualizing web statistics

Tim inquired about: how to create an elegant graph for Web visitor
Read More
Subjectivity
Color

Subjectivity

When I look at charts like this one, I ponder: Should graph
Read More
Wading in waste
Bar chart

Wading in waste

A poor graphic leaves readers wading in waste, in this case, the
Read More
Enigma of the big-buck pitcher
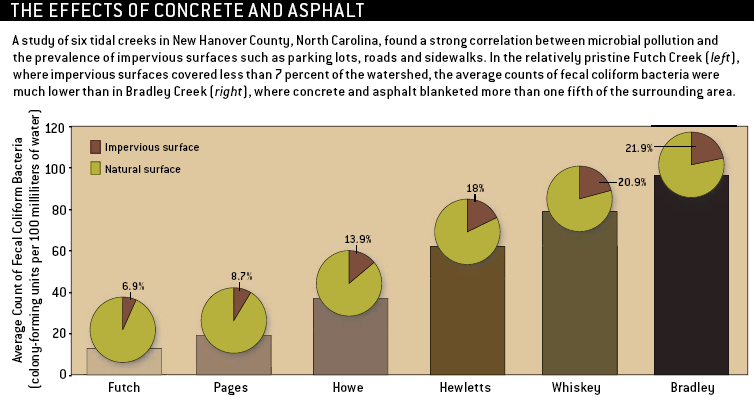
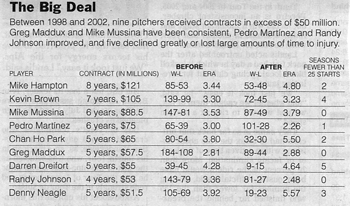
Clustering

Enigma of the big-buck pitcher

A data table accompanied a recent NYT article pointing out that big-buck
Read More
← Newer Posts Page 5 of 5
Junk Charts © 2025
  • BOOKS
  • COURSES
  • PRESS
  • CONSULTING
  • COACHING
  • CONTACT
Powered by Ghost