Junk Charts
About
RSS
Posts by Year
Posts by Keywords
Sign in
Subscribe
Sorting
Dot plot
Out of line
Out of line
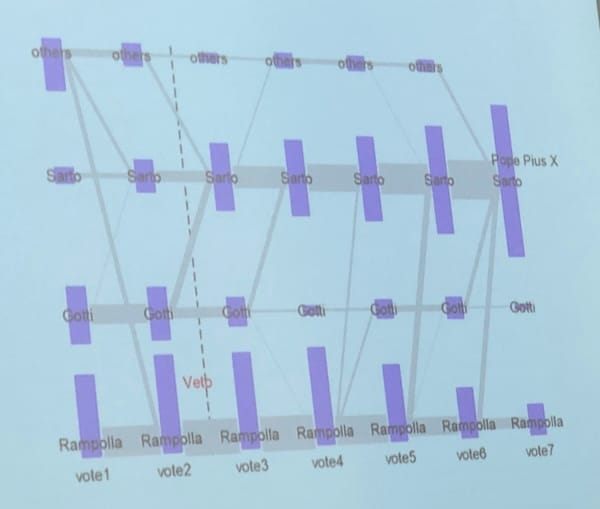
hammock plot
Hammock plots
Matthias Schonlau introduces the hammock plot.
Color
Patiently looking
Patiently looking at a map
Axis
Simple presentations
In the previous post, I looked at this chart that shows the
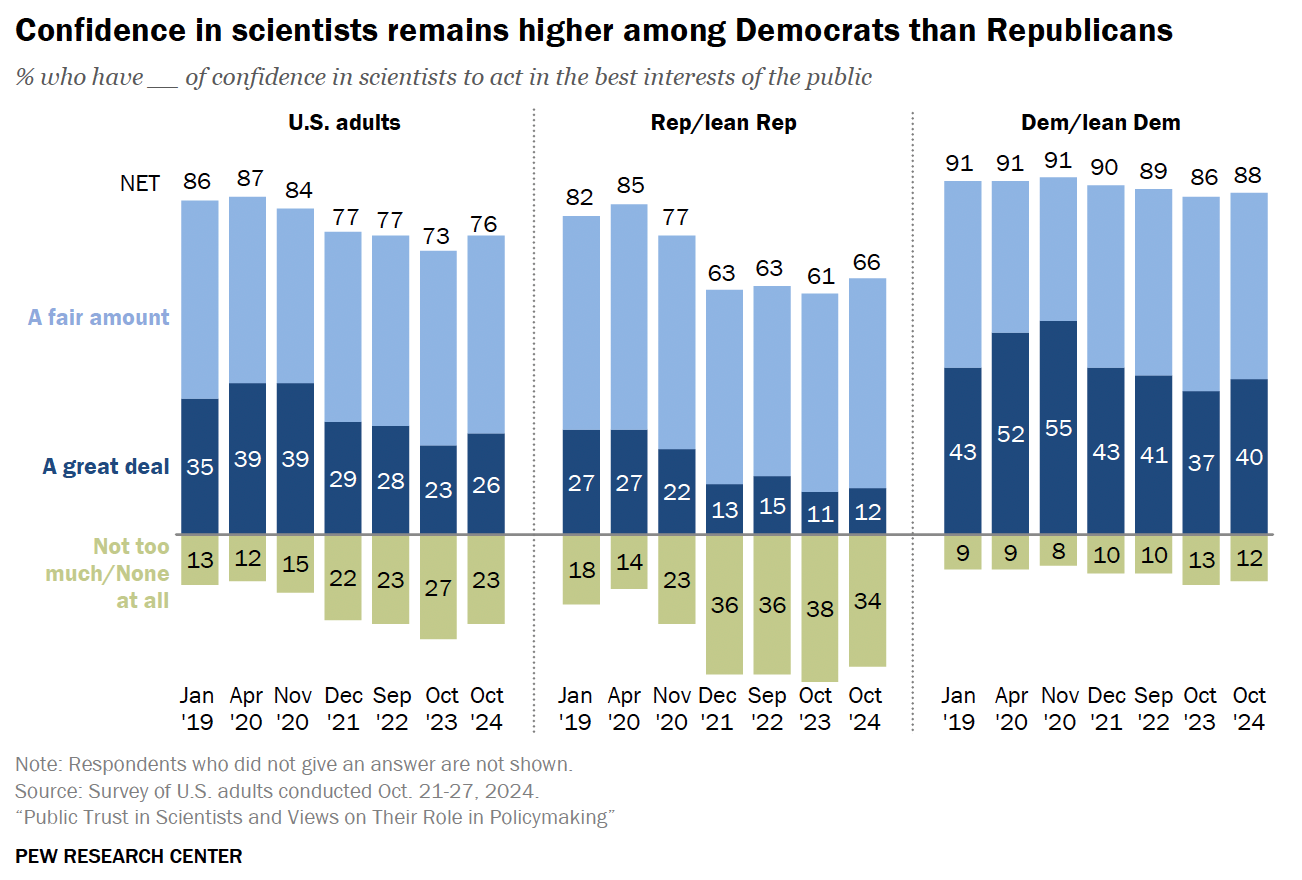
Bar chart
the wtf moment
the wtf moment in dataviz
Bar chart
Dizziness
Dizziness is probably not an intended goal of charting
←
Newer Posts
Page 2 of 10
Older Posts
→