Junk Charts
  • About
  • RSS
  • Posts by Year
  • Posts by Keywords
Sign in Subscribe

Statistics

Two challenging charts showing group distributions
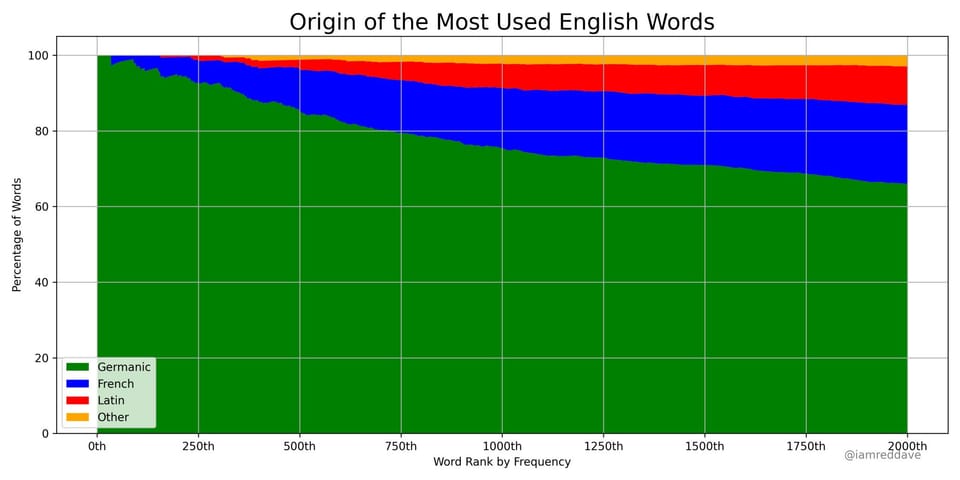
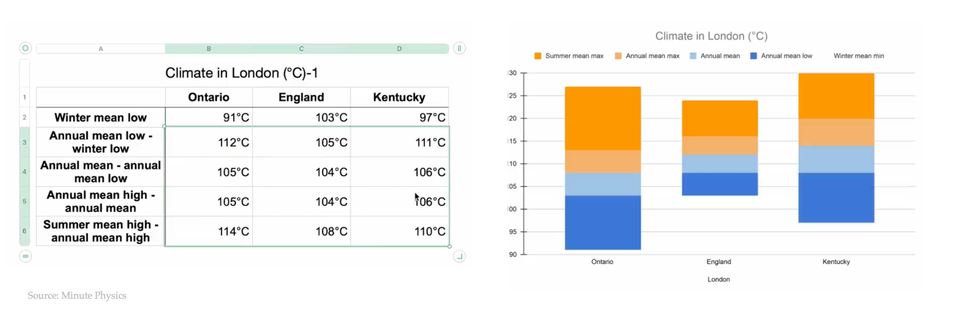
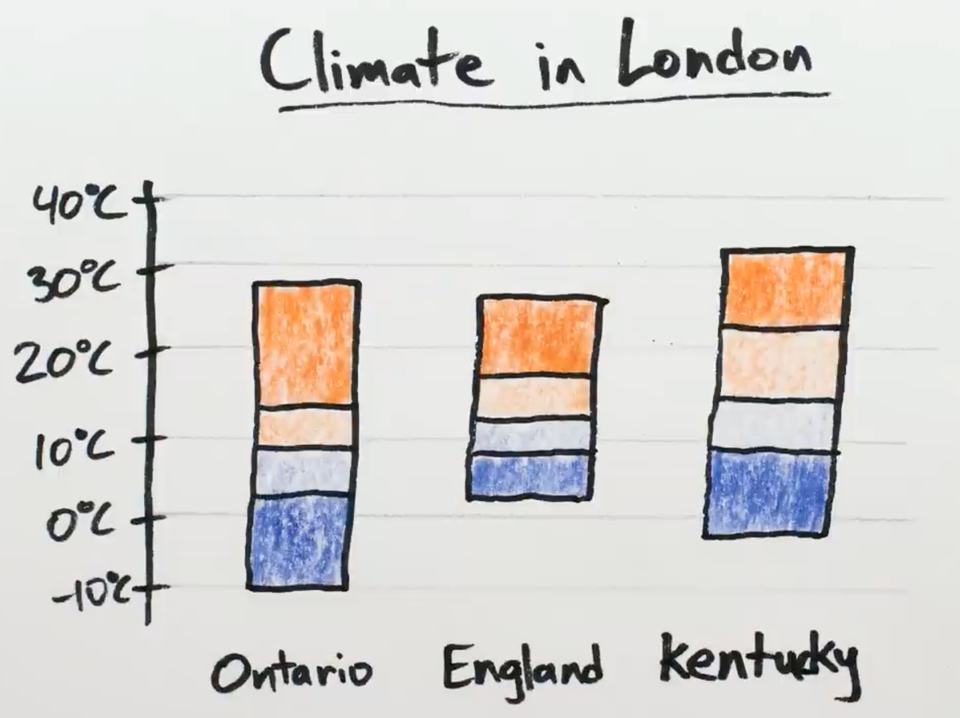
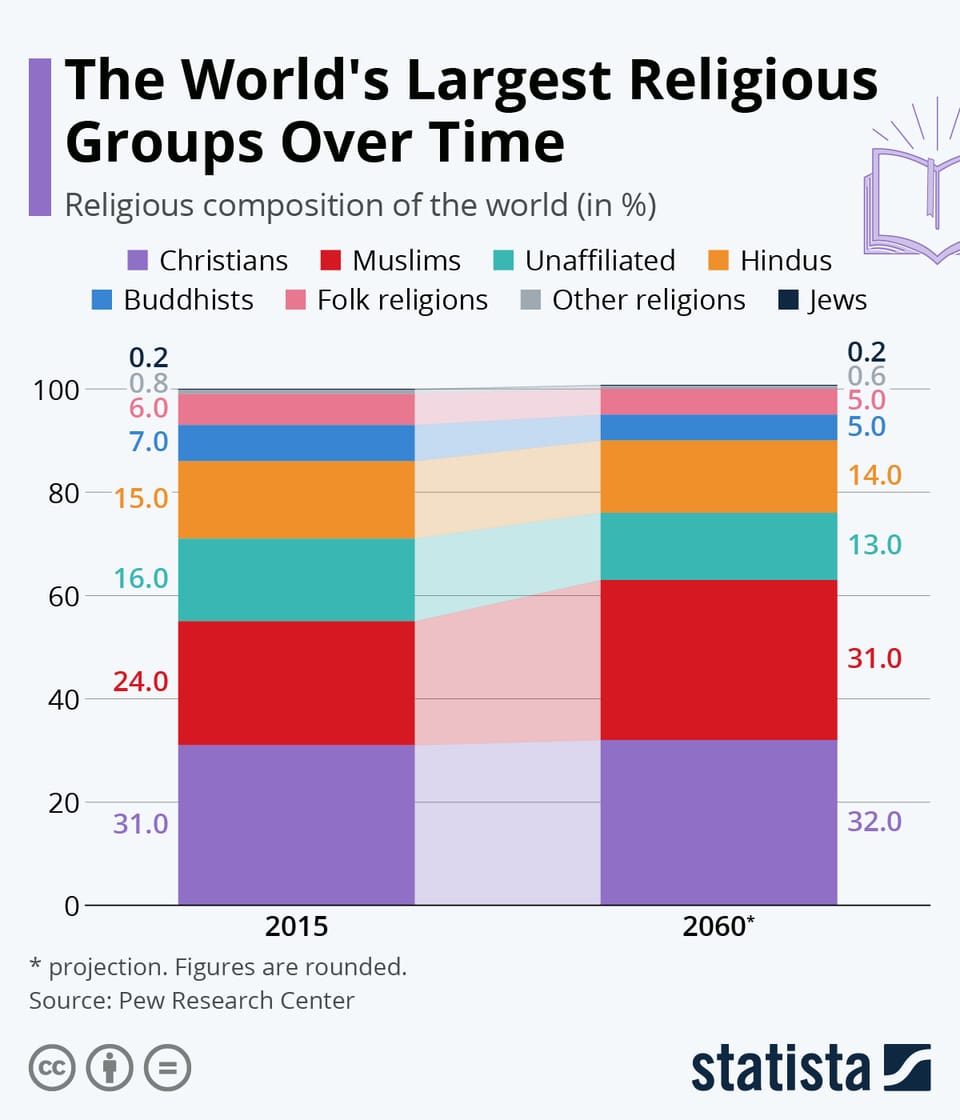
Area chart

Two challenging charts showing group distributions

Two complex charts that show subgroup distributions of data
Read More
The science of counting more people using fewer people
Aggregation

The science of counting more people using fewer people

Trying to count more with less
Read More
How hard can counting be?
Analytics-business interaction

How hard can counting be?

How hard can counting be? Reflections on the jump in homeless in the US
Read More
Five-value summaries of distributions
Boxplot

Five-value summaries of distributions

Using five numbers ot summarize data distributions
Read More
What is this "stacked range chart"?
Aggregation

What is this "stacked range chart"?

Do we need this "stacked range chart"?
Read More
Dizziness
Bar chart

Dizziness

Dizziness is probably not an intended goal of charting
Read More
← Newer Posts Page 4 of 19 Older Posts →
Junk Charts © 2026
  • BOOKS
  • COURSES
  • PRESS
  • CONSULTING
  • COACHING
  • CONTACT
Powered by Ghost