Junk Charts
About
RSS
Posts by Year
Posts by Keywords
Sign in
Subscribe
Statistics
Background
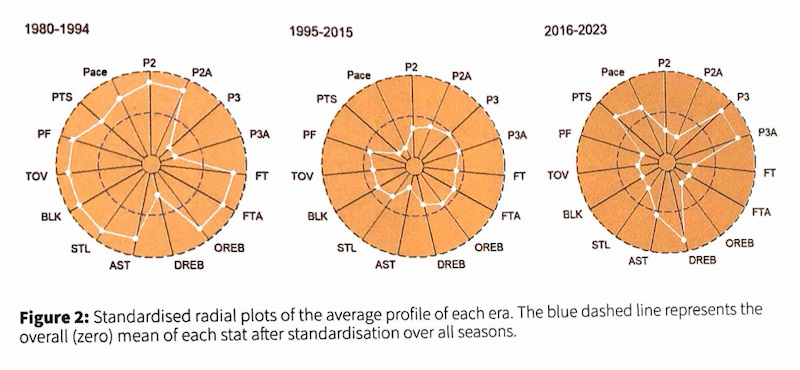
The radial is still broken
Kaiser puzzles out yet another radial chart.
Axis
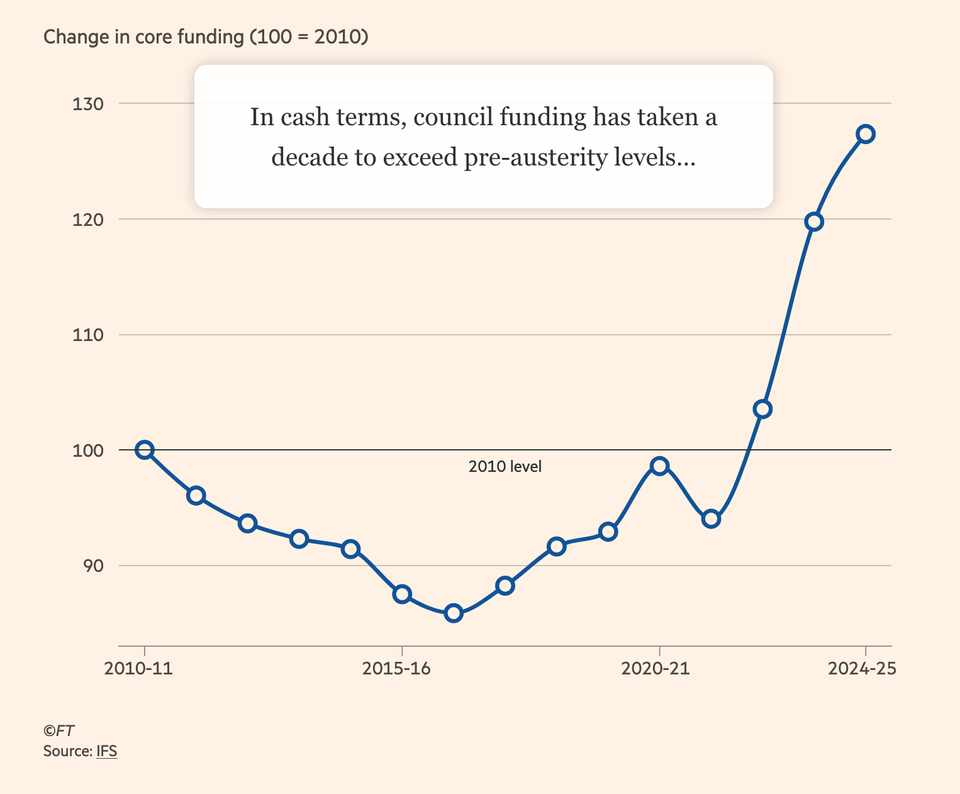
Adjust, and adjust some more
Kaiser looks at an interactive chart in the Financial Times.
Aggregation
Combining probabilities
Kaiser explains how probabilities are aggregated.
Bar chart
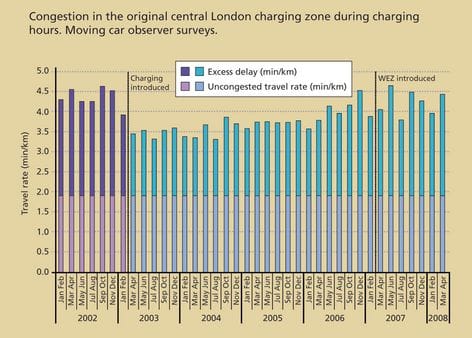
Excess delay
Kaiser finds a chart that analyzes London's congestion charging programme.
Aggregation
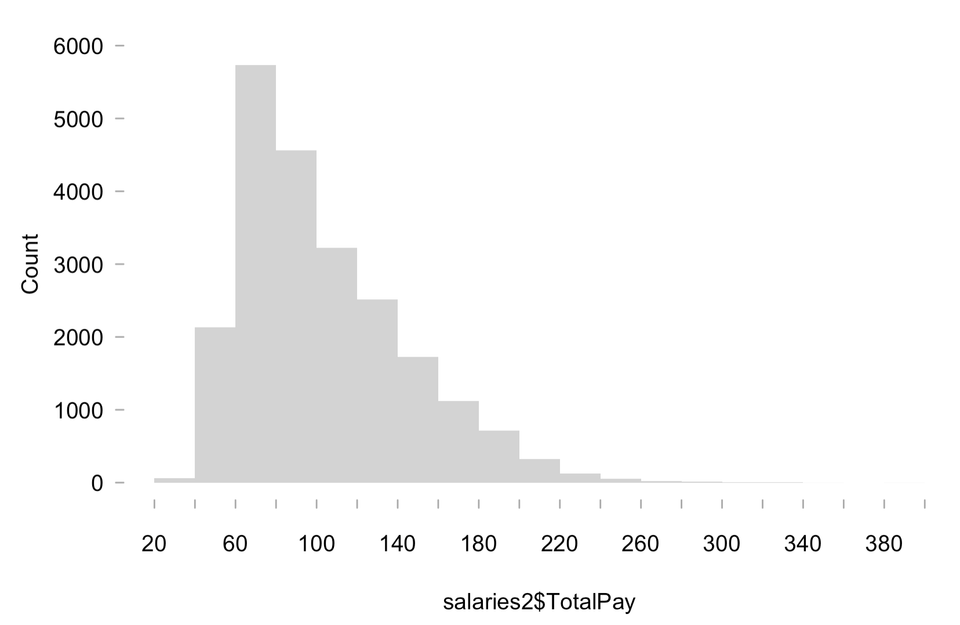
What's a histogram?
Kaiser introduces his talk about histograms.
Bar chart
My talk next week on histograms
Kaiser will be giving a talk next week.
←
Newer Posts
Page 6 of 19
Older Posts
→