Junk Charts
  • About
  • RSS
  • Posts by Year
  • Posts by Keywords
Sign in Subscribe

Text

The reckless practice of eyeballing trend lines
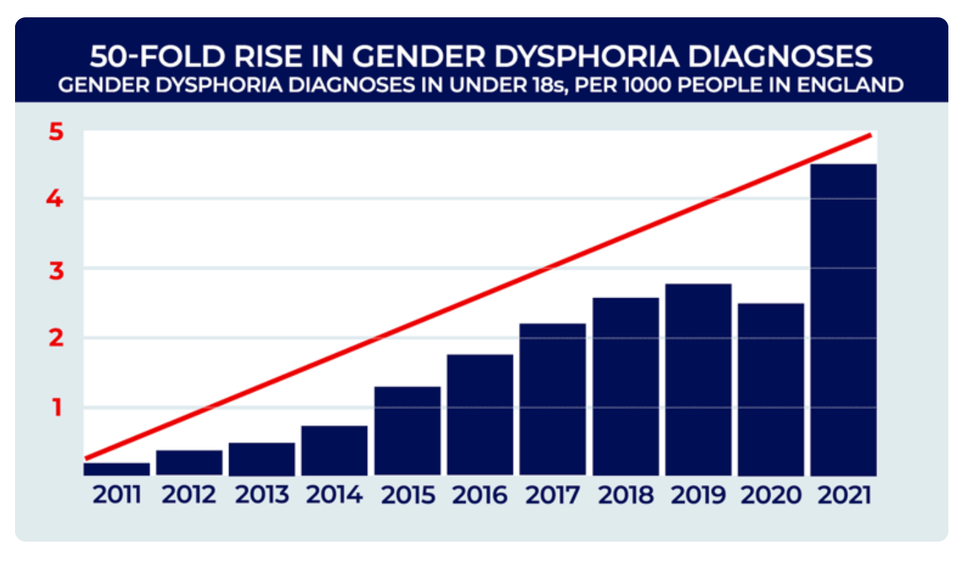
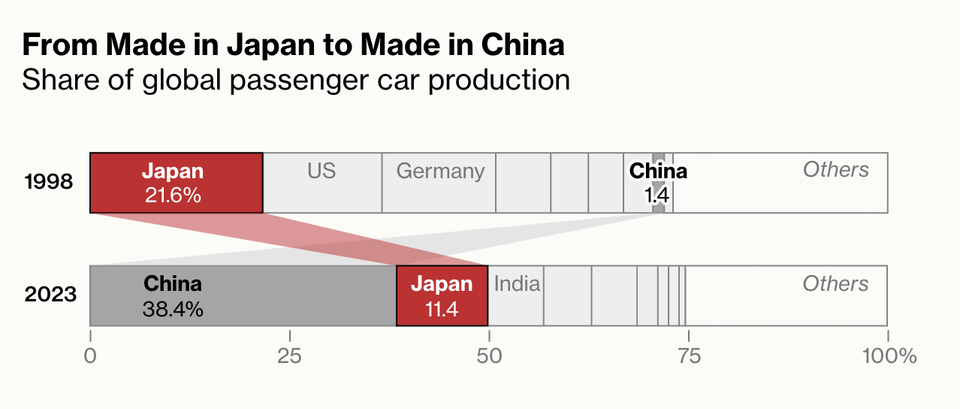
Bar chart

The reckless practice of eyeballing trend lines

The reckless practice of eyeballing trend lines
Read More
Don't show everything
Aggregation

Don't show everything

Plotting lots of data but conveying not much information
Read More
Dot plots with varying dot sizes
Aggregation

Dot plots with varying dot sizes

An example of a dot plot with varying dot sizes
Read More
Fantastic auto show from the Bloomberg crew
Bar chart

Fantastic auto show from the Bloomberg crew

Bloomberg Graphics put on an auto show
Read More
Small tweaks that make big differences
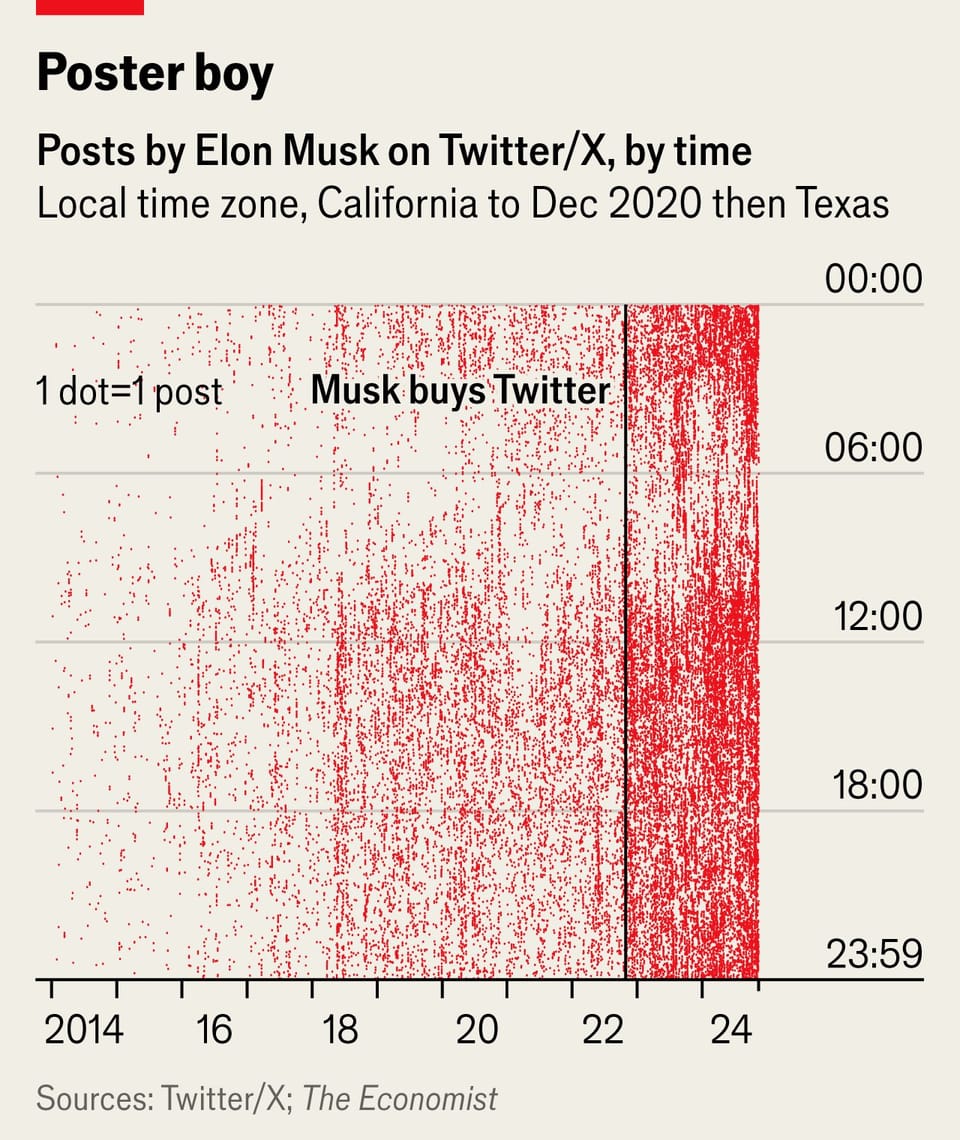
Axis

Small tweaks that make big differences

Some small tweaks to data graphics make a huge difference
Read More
Excess delay
Bar chart

Excess delay

Kaiser finds a chart that analyzes London's congestion charging programme.
Read More
← Newer Posts Page 3 of 5 Older Posts →
Junk Charts © 2026
  • BOOKS
  • COURSES
  • PRESS
  • CONSULTING
  • COACHING
  • CONTACT
Powered by Ghost