Junk Charts
  • About
  • RSS
  • Posts by Year
  • Posts by Keywords
Sign in Subscribe

Time series

Guide to using pairs of circles
Bubble chart

Guide to using pairs of circles

A discussion of some design decisions
Read More
Another test of self-sufficiency
self-sufficiency test

Another test of self-sufficiency

Reading an infographic of Swiss elections
Read More
The story on international students coming to the U.S.
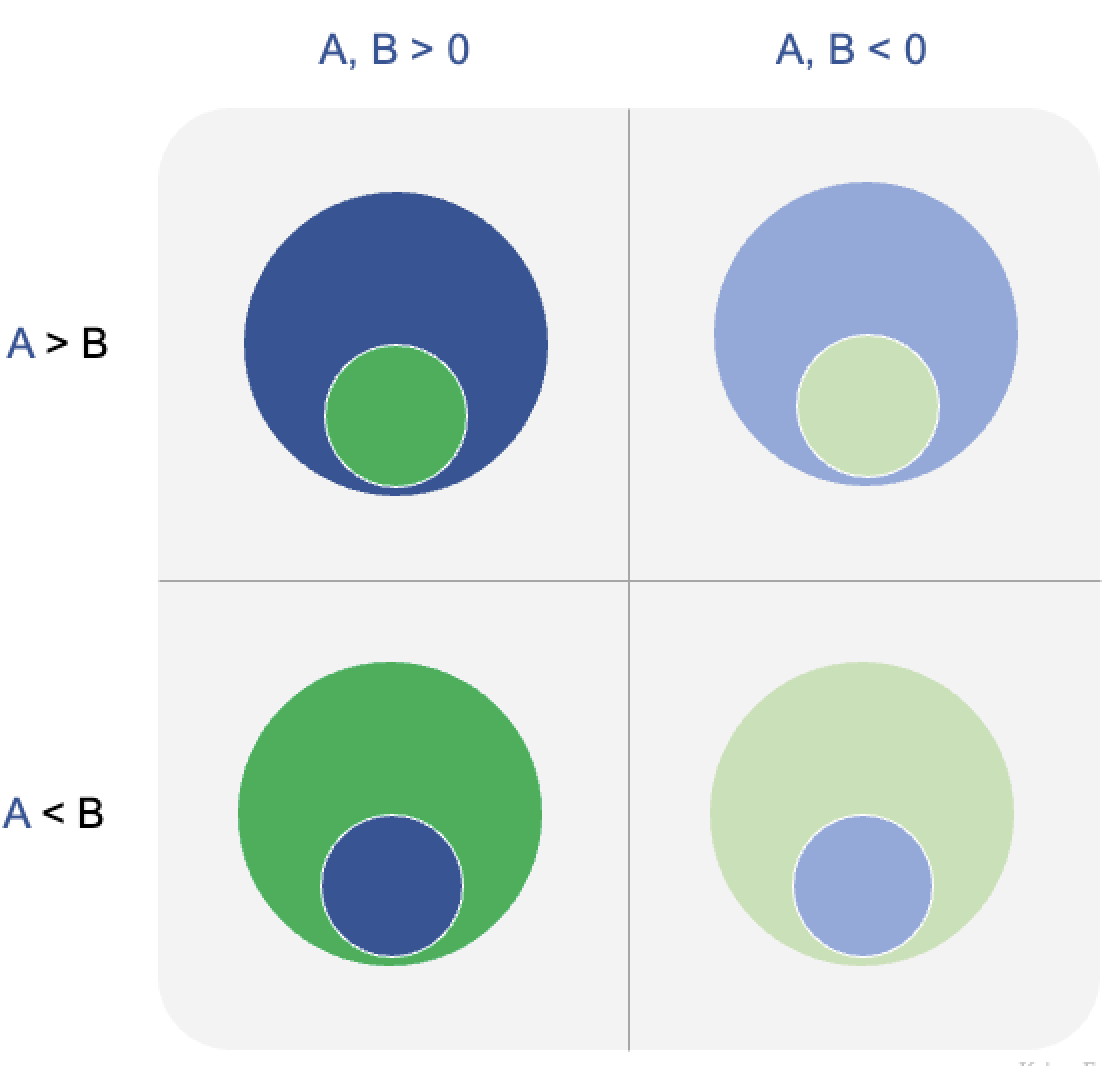
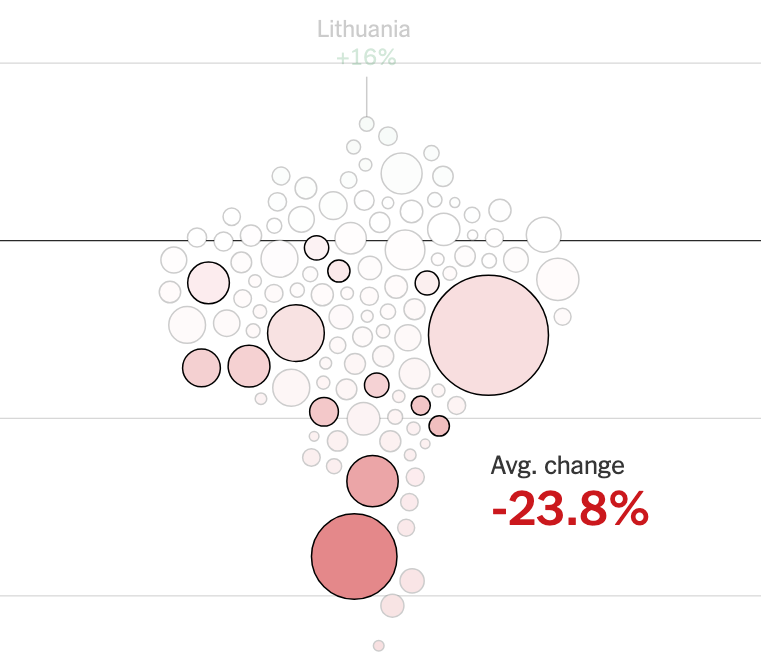
visual storytelling

The story on international students coming to the U.S.

How to visualize complex datasets
Read More
Big drops and big dots
line chart

Big drops and big dots

Droppings at BLS
Read More
Peak social media? Depends on how you measure it
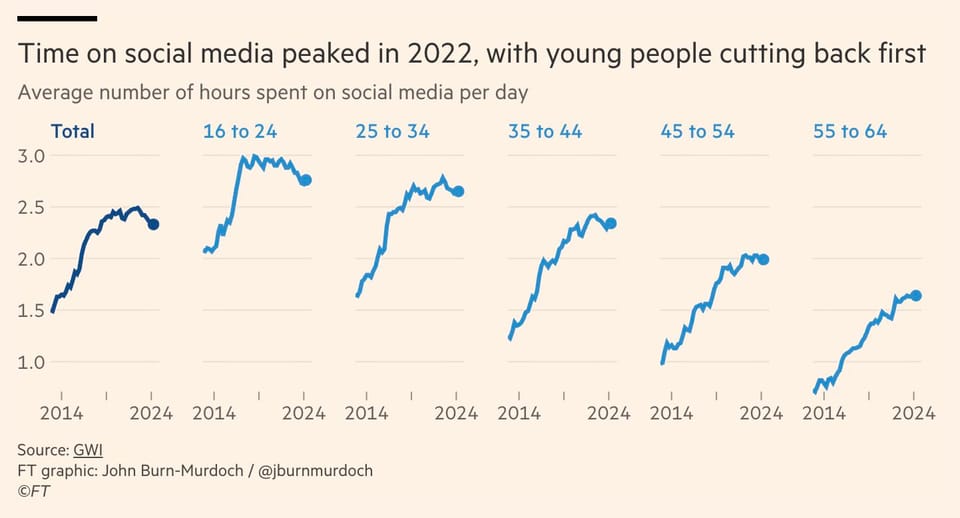
cohort

Peak social media? Depends on how you measure it

Separating individual and group effects over time
Read More
Putting the ladder of abstraction into practice
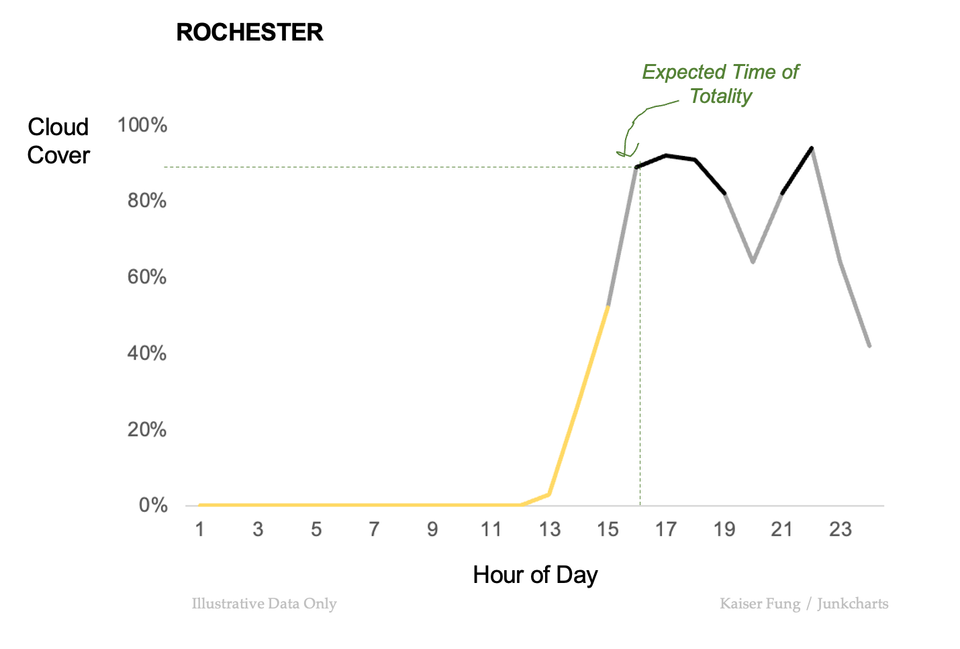
abstraction

Putting the ladder of abstraction into practice

Explaining complexity one piece at a time
Read More
Page 1 of 21 Older Posts →
Junk Charts © 2026
  • BOOKS
  • COURSES
  • PRESS
  • CONSULTING
  • COACHING
  • CONTACT
Powered by Ghost