Junk Charts
  • About
  • RSS
  • Posts by Year
  • Posts by Keywords
Sign in Subscribe

Time series

A graphlick showing mortgage prices
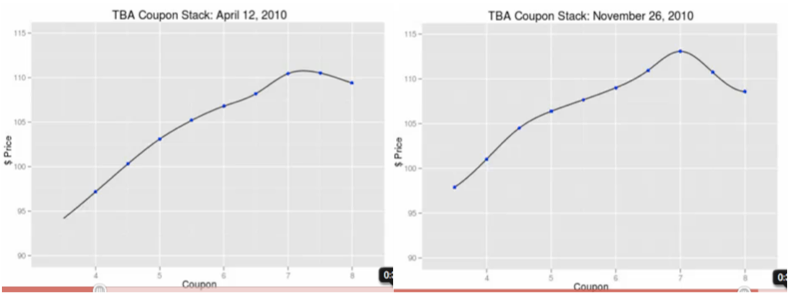
Business

A graphlick showing mortgage prices

The work of Hans Rosling and Gapminder (now part of Google) highlighted
Read More
Making charts beautiful without adding unneeded bits
streamgraph

Making charts beautiful without adding unneeded bits

What is the message?
Read More
What is seasonal adjustment and why is it used?
Aggregation

What is seasonal adjustment and why is it used?

Quick guide to seasonal adjustments
Read More
Further views of unemployment
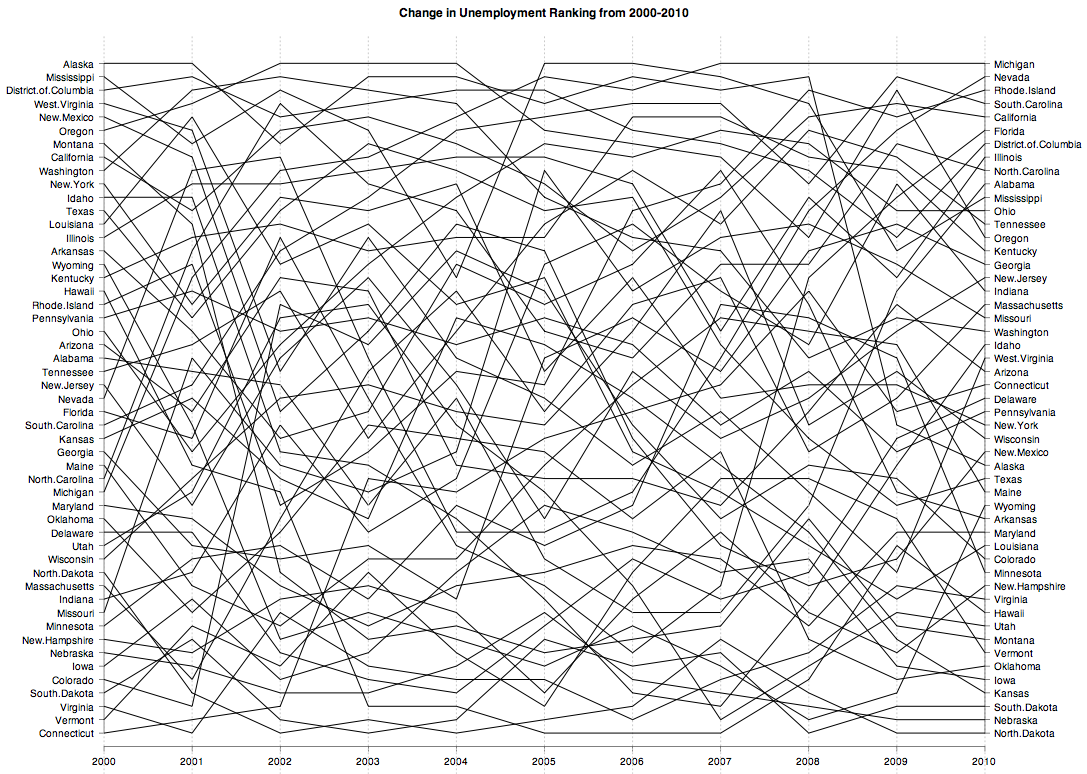
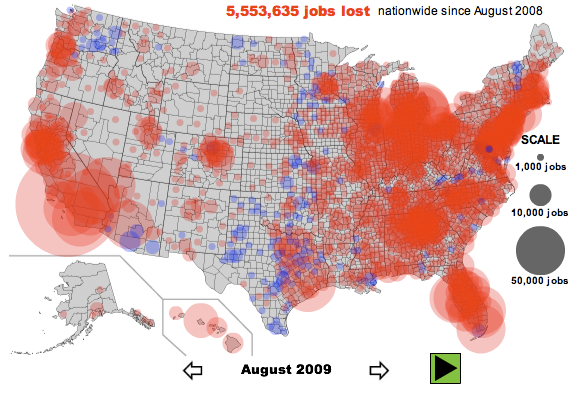
Aggregation

Further views of unemployment

Instead of looking at unemployment rates across the 50 states plus D.
Read More
Different pictures of unemployment
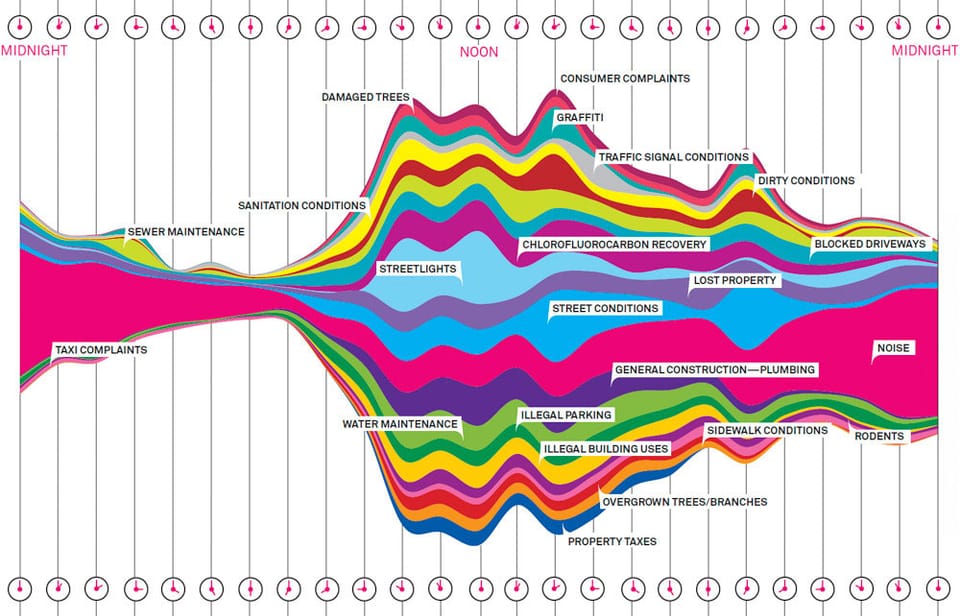
Aggregation

Different pictures of unemployment

Unemployment and job losses being such a worrying social problem in the
Read More
From fellow readers
Area chart

From fellow readers

Have been getting a lot of reader suggestions lately. Thanks to all
Read More
← Newer Posts Page 16 of 21 Older Posts →
Junk Charts © 2026
  • BOOKS
  • COURSES
  • PRESS
  • CONSULTING
  • COACHING
  • CONTACT
Powered by Ghost