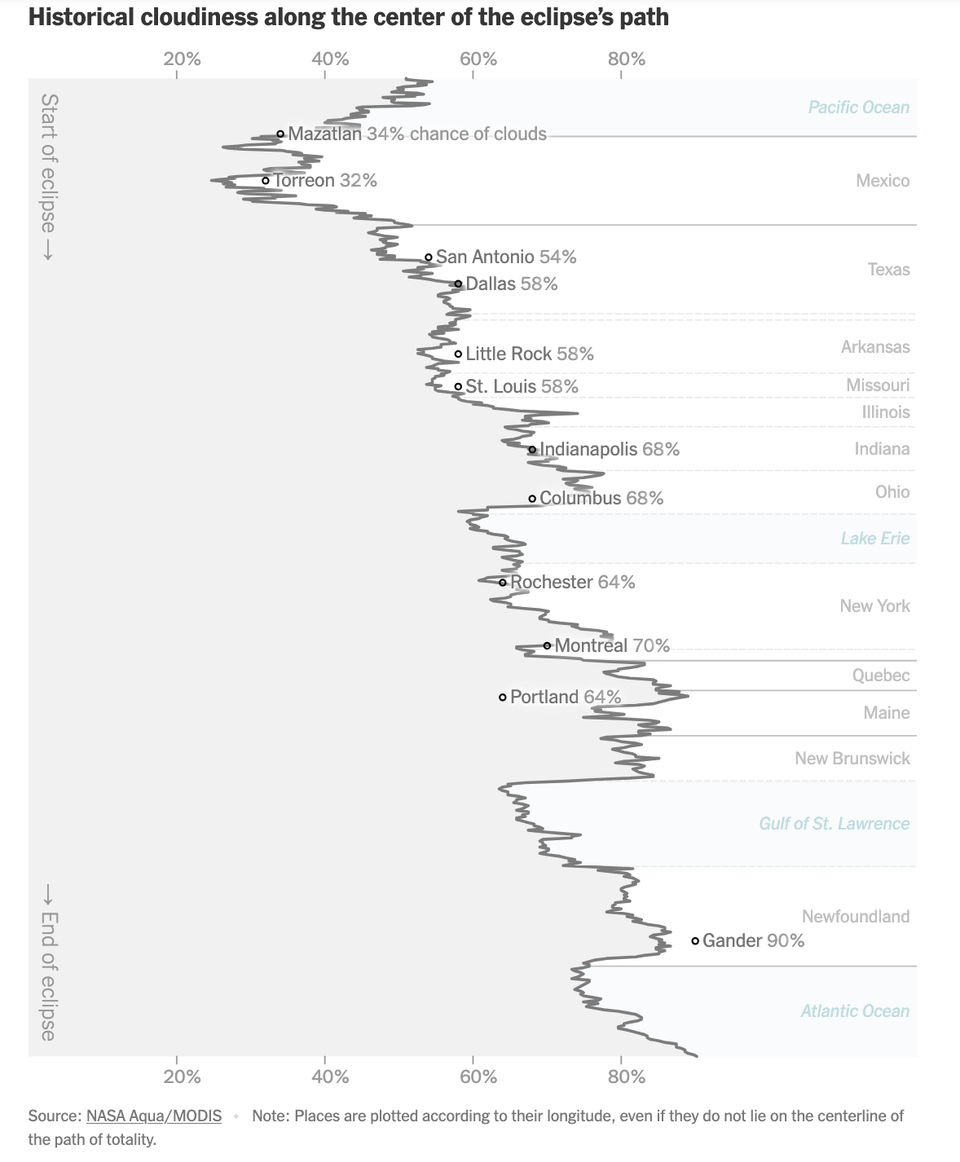
Junk Charts
About
RSS
Posts by Year
Posts by Keywords
Sign in
Subscribe
Time series
Axis
A second look at that axis
Why are there gaps in the labels?
Bar chart
Reflection on two design quirks
Slanting and breaking columns
Bar chart
Simple is not always easy
Simple design is not always easy
interpretation
Clear and confused states
What does pink mean on this map?
histogram
Why is this chart confusing?
A confusing chart on Broadway shows
Bar chart
Color bomb
Color bomb in AI analytics
←
Newer Posts
Page 2 of 21
Older Posts
→