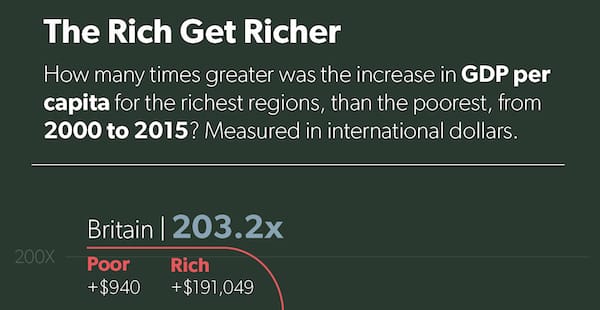
ray vella Displaying convoluted indices Kaiser shows how a small change in structure clarifies comparisons on a data visualization project.
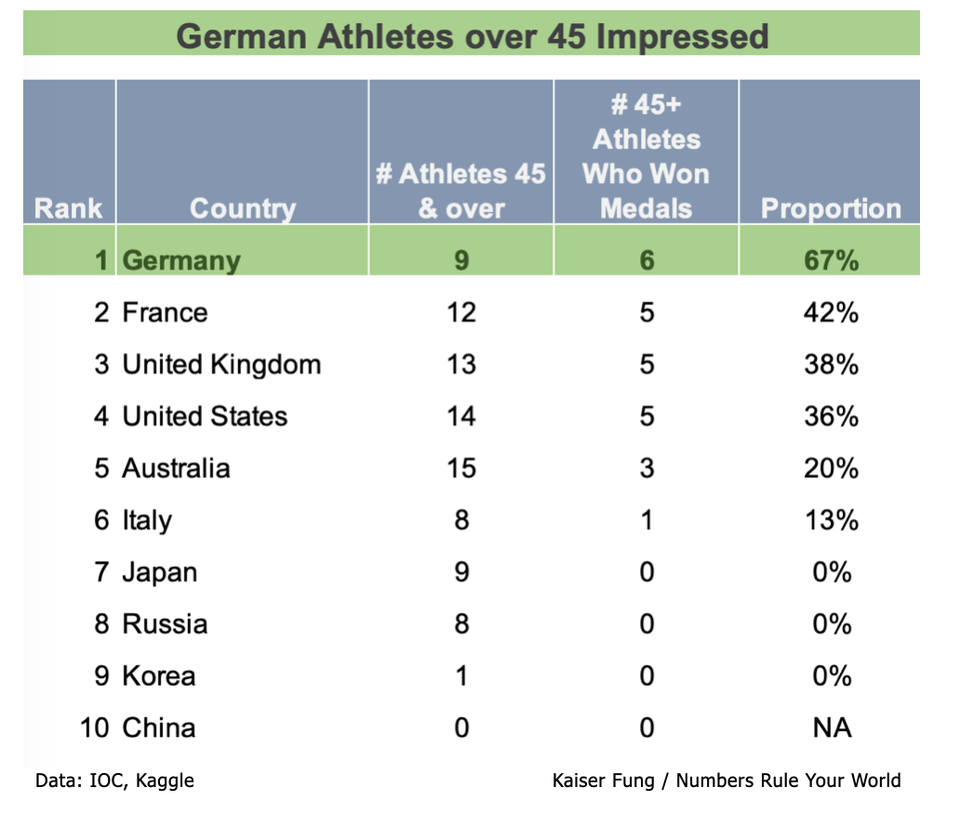
Big Data Round 2: 10 Ways to Rank the Rio Summer Olympics Kaiser finds another set of 10 metrics that can be used to rank any country top of the medals table.
ray vella Two commendable student projects, showing different standards of beauty Kaiser discusses two dataviz projects by NYU students.
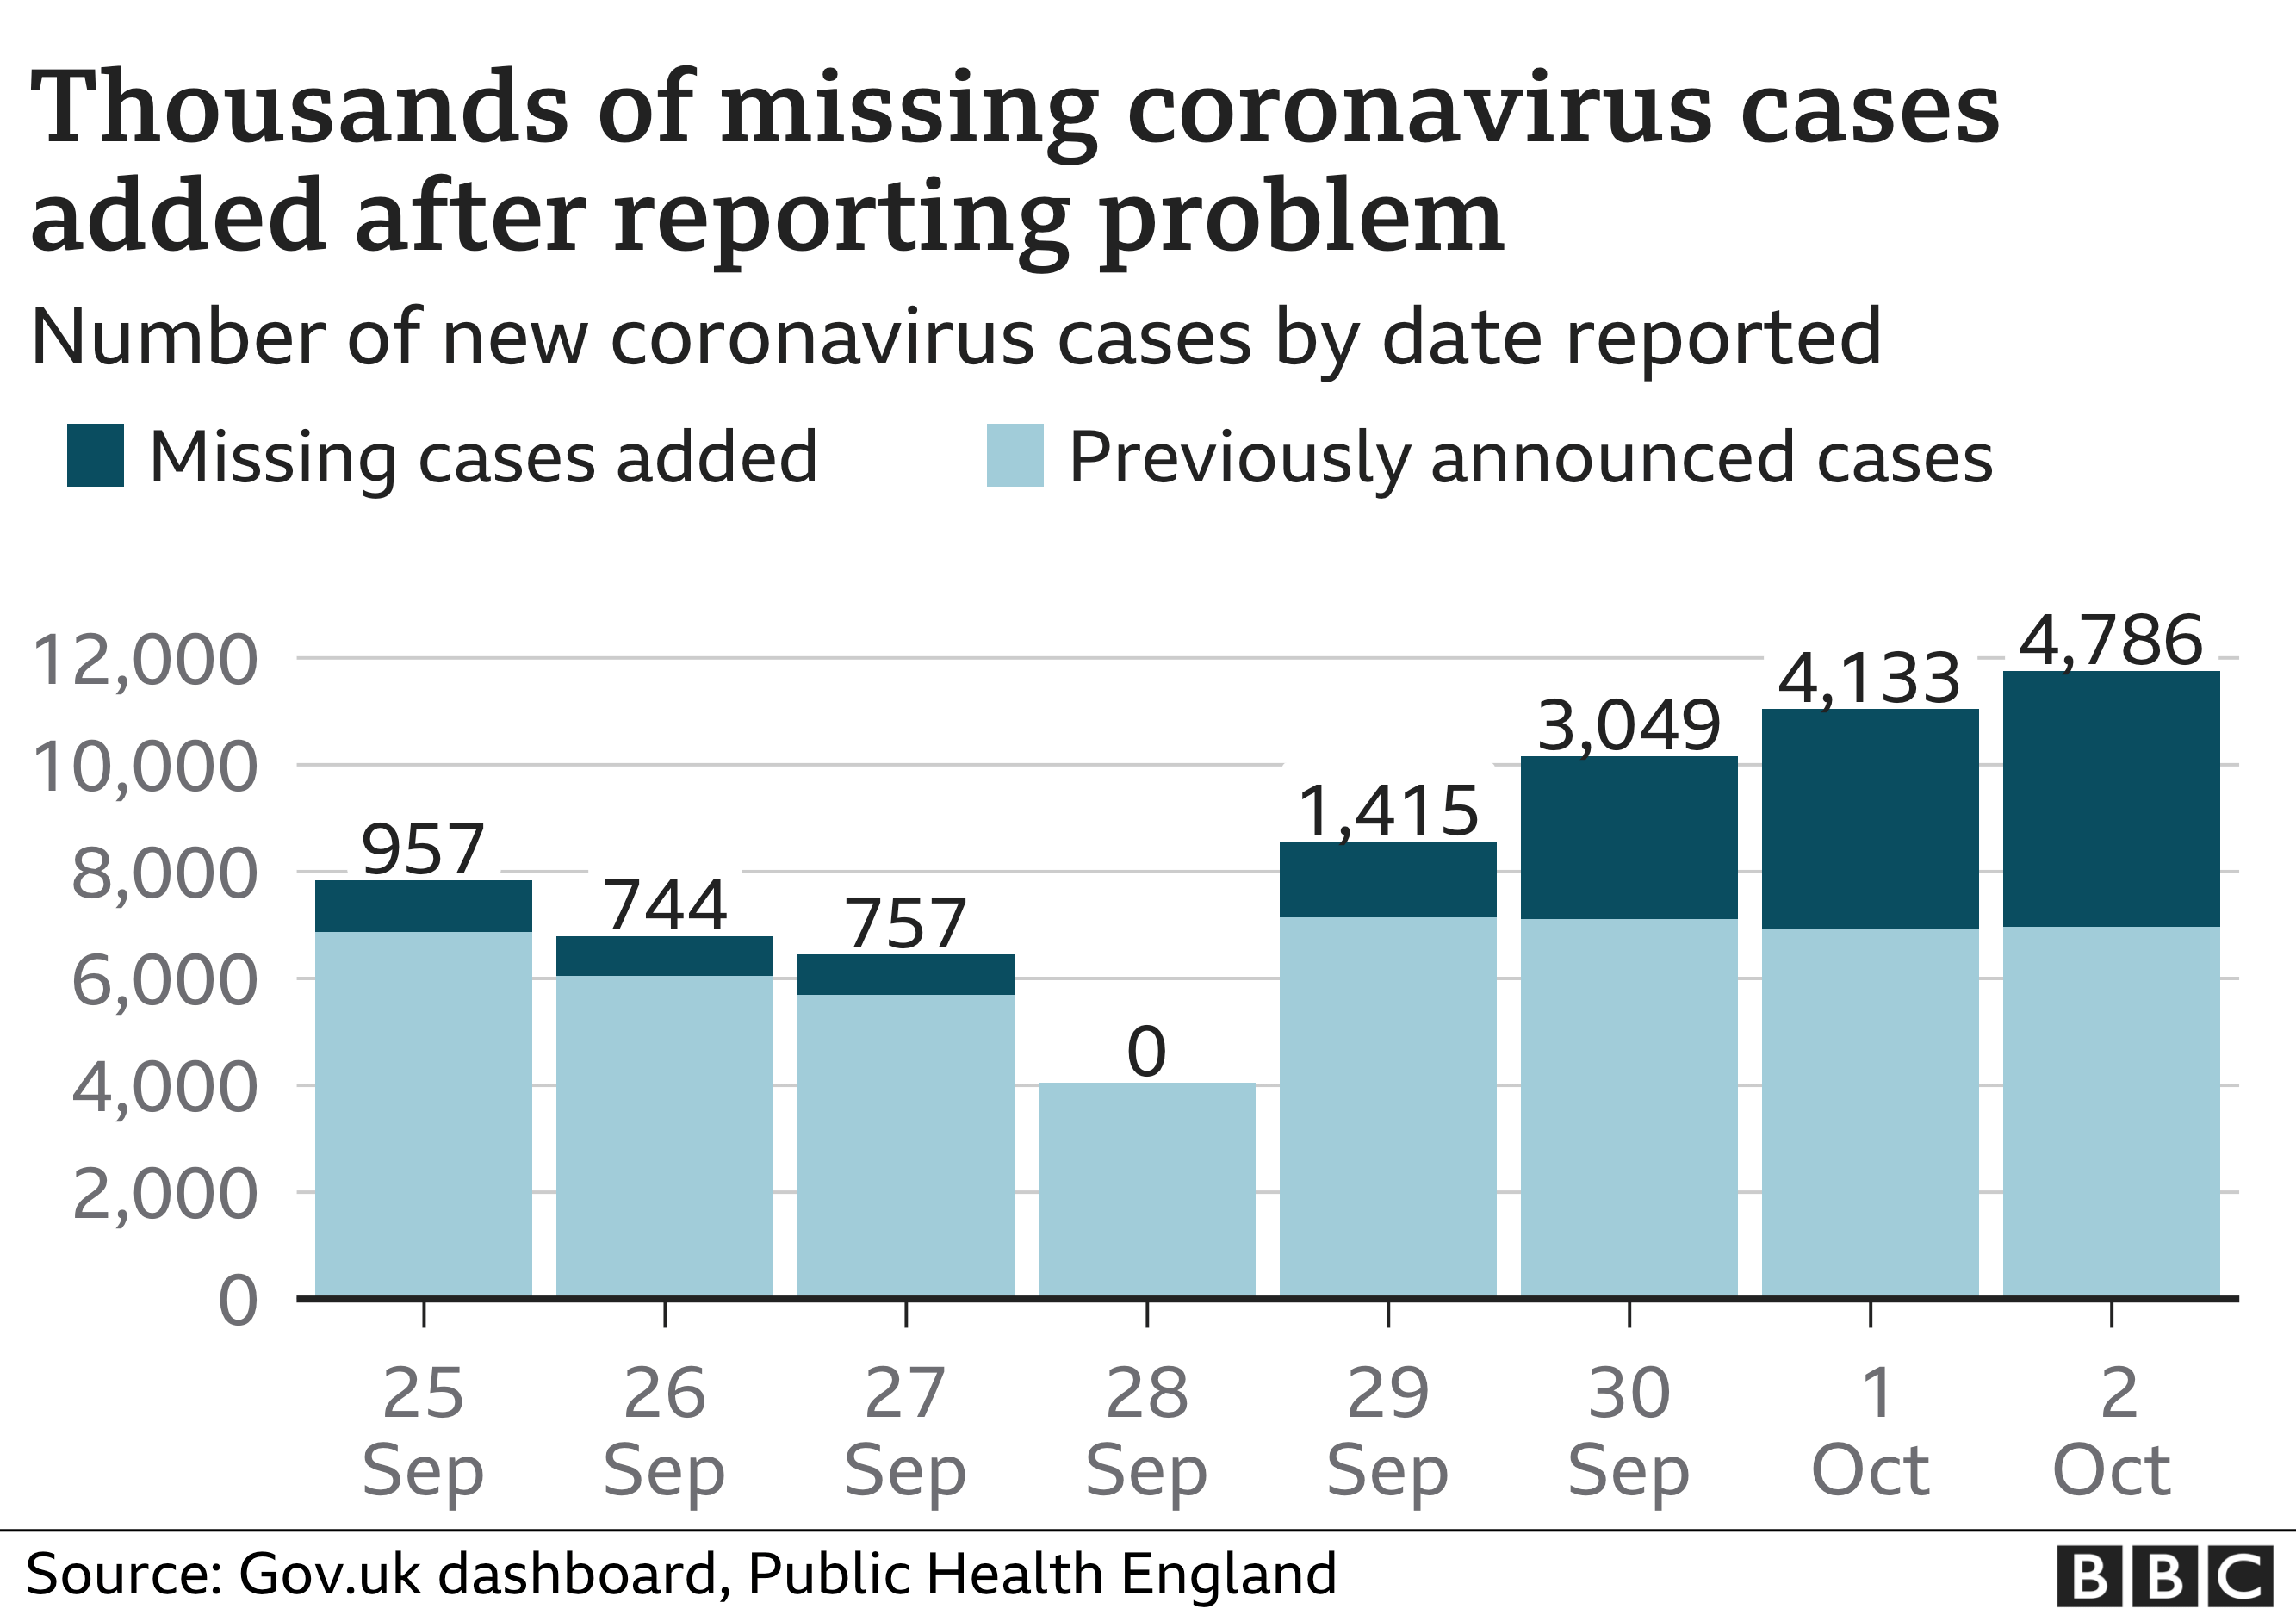
Excel Dr. Backlog jumps the pond Kaiser investigates the official reason for U.K. under-reporting of coronavirus cases.
standardized testing A testing mess across the pond Kaiser takes a glance at the A-Levels controversy in the U.K.