Junk Charts
  • About
  • RSS
  • Posts by Year
  • Posts by Keywords
Sign in Subscribe

Variance

Prime visual story-telling
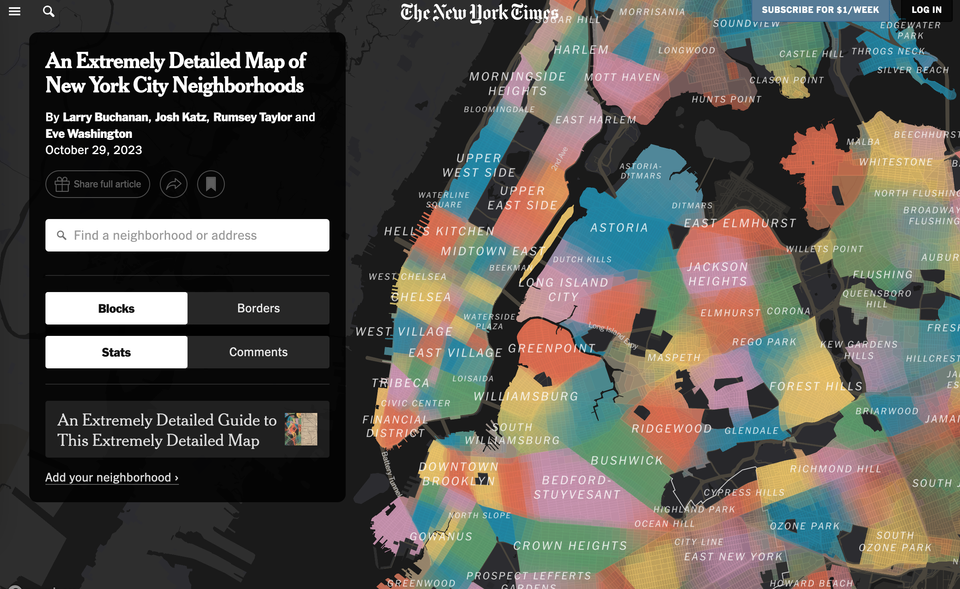
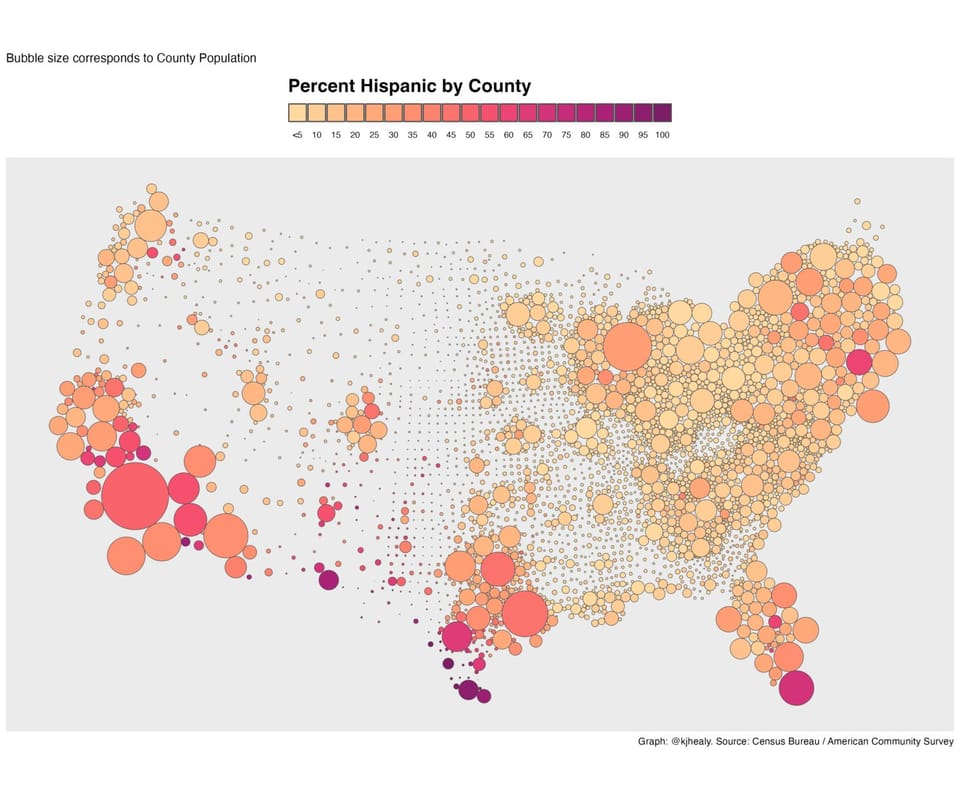
Clustering

Prime visual story-telling

Kaiser appreciates this wonderful example of visual storytelling.
Read More
Chart without an axis
Axis

Chart without an axis

Kaiser looks at a variant of a standard chart form.
Read More
The curse of dimensions
Aggregation

The curse of dimensions

Kaiser considers some bubble maps.
Read More
My talk next week on histograms
Bar chart

My talk next week on histograms

Kaiser will be giving a talk next week.
Read More
Do you want a taste of the new hurricane cone?
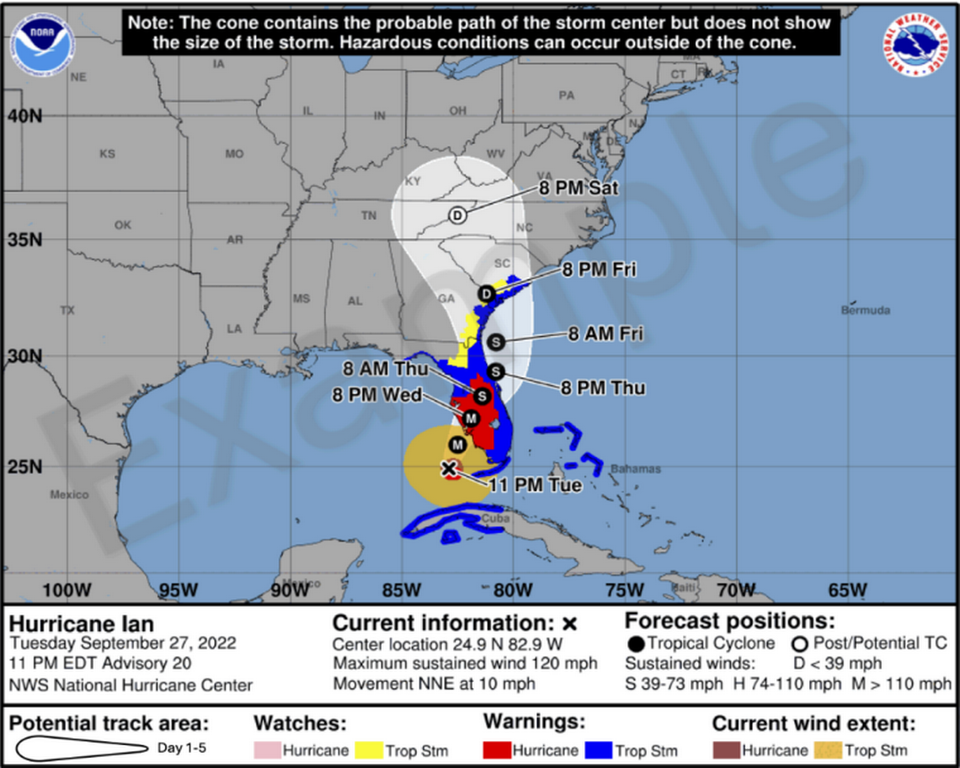
Aggregation

Do you want a taste of the new hurricane cone?

The National Hurricane Center (NHC) put out a press release (link to
Read More
Lost in the middle class
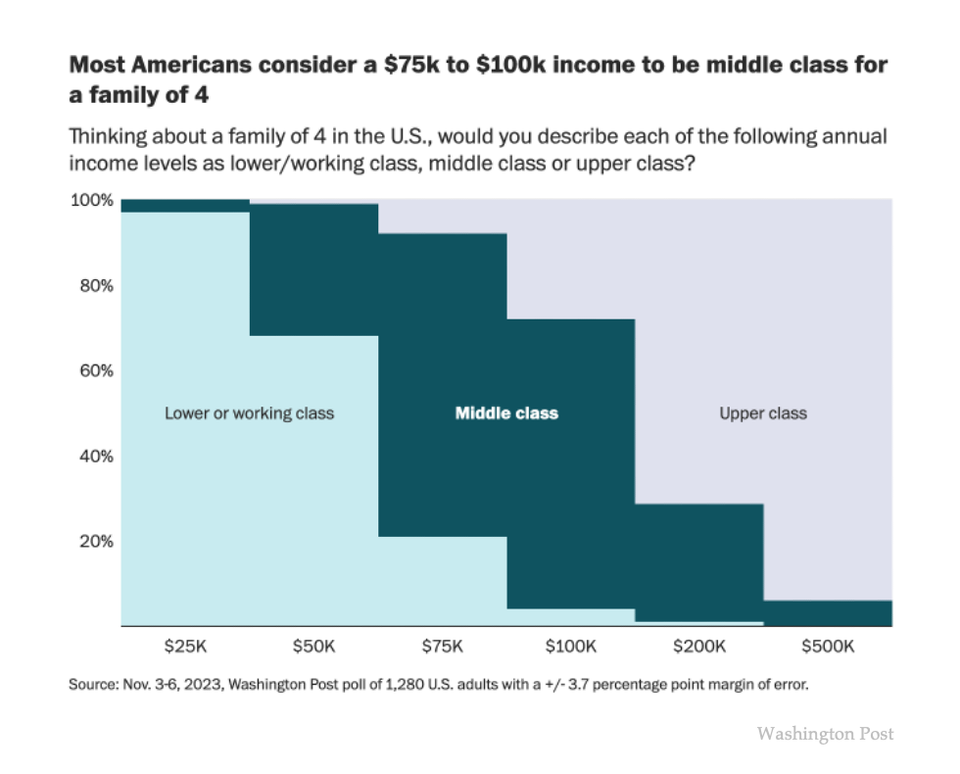
income distribution

Lost in the middle class

Kaiser reads how the Washington Post defines middle class.
Read More
← Newer Posts Page 6 of 15 Older Posts →
Junk Charts © 2025
  • BOOKS
  • COURSES
  • PRESS
  • CONSULTING
  • COACHING
  • CONTACT
Powered by Ghost