Junk Charts
  • About
  • RSS
  • Posts by Year
  • Posts by Keywords
Sign in Subscribe

visual storytelling

The largest gambling market in Europe, and the largest online
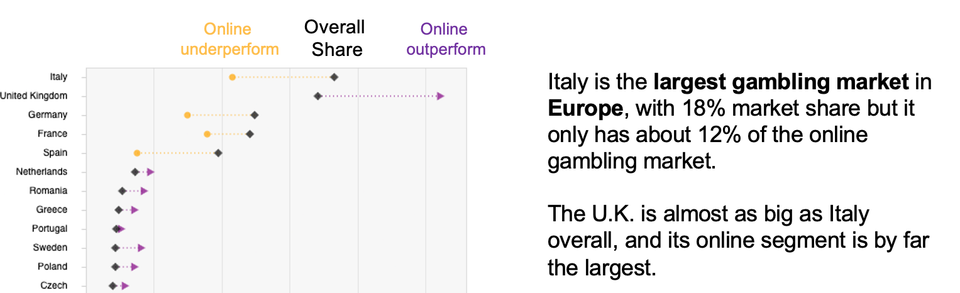
visual storytelling

The largest gambling market in Europe, and the largest online

Kaiser re-imagines the chart about Europe's gambling revenues.
Read More
Facetune your charts
visual storytelling

Facetune your charts

The art of sacrificing precision
Read More
The story on international students coming to the U.S.
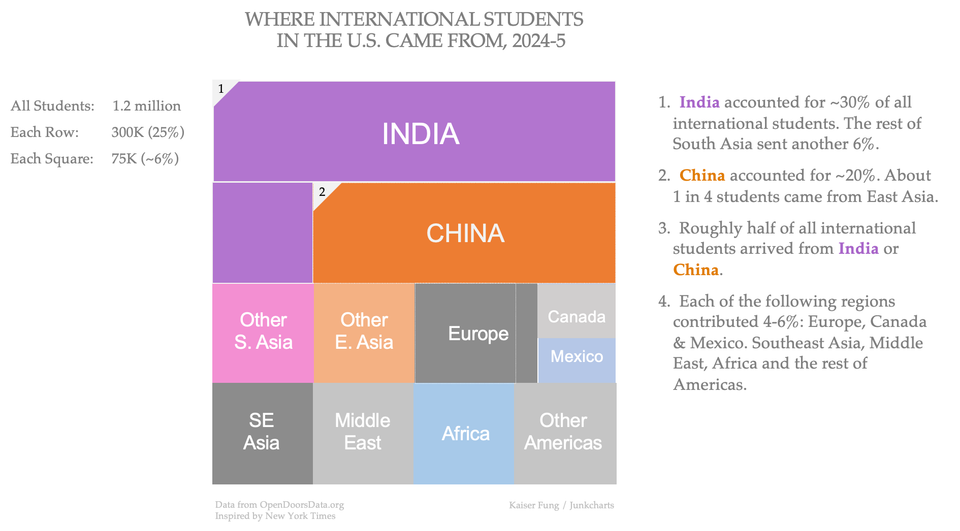
visual storytelling

The story on international students coming to the U.S.

How to visualize complex datasets
Read More
Dot plots with varying dot sizes
Aggregation

Dot plots with varying dot sizes

An example of a dot plot with varying dot sizes
Read More
Election coverage prompts good graphics
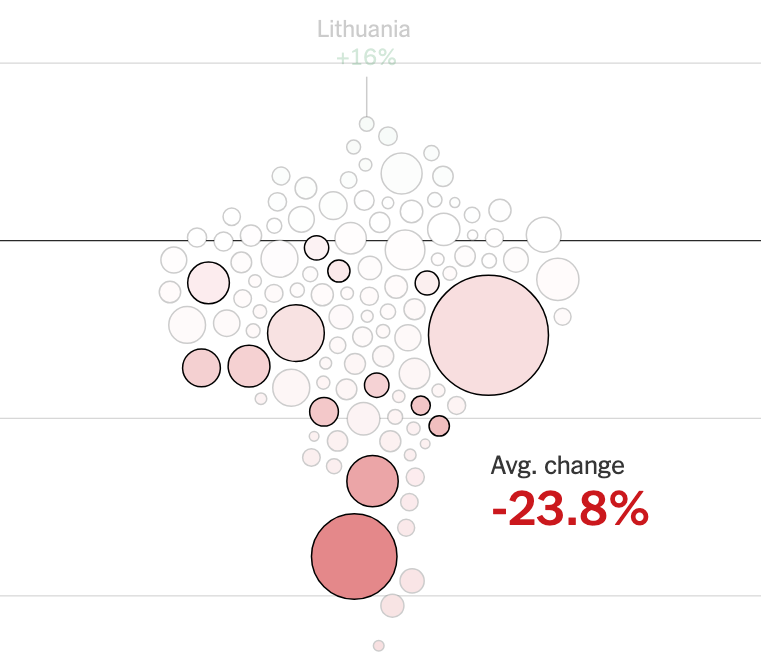
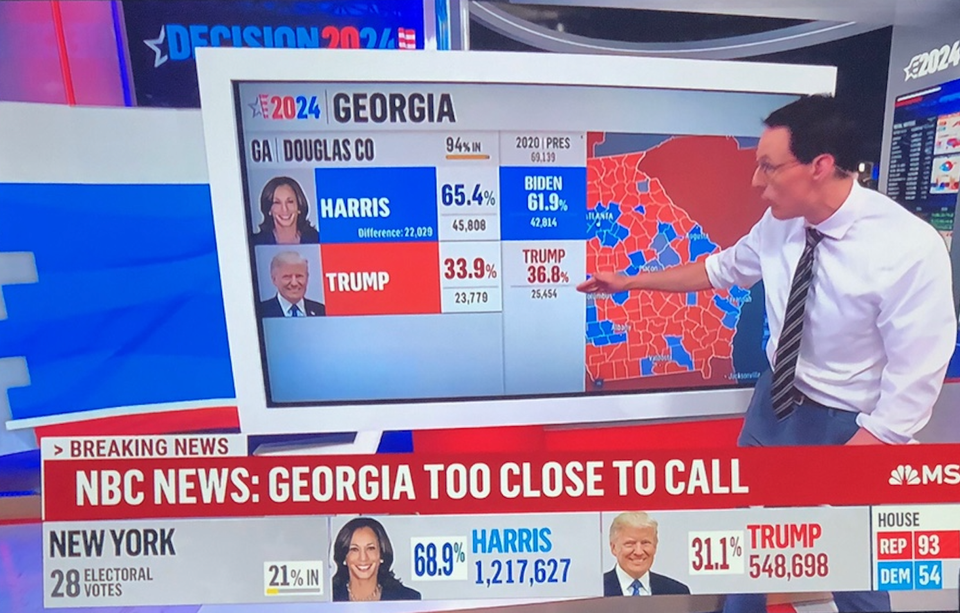
Aggregation

Election coverage prompts good graphics

Election coverage brings out the best of interactive graphics
Read More
Prime visual story-telling
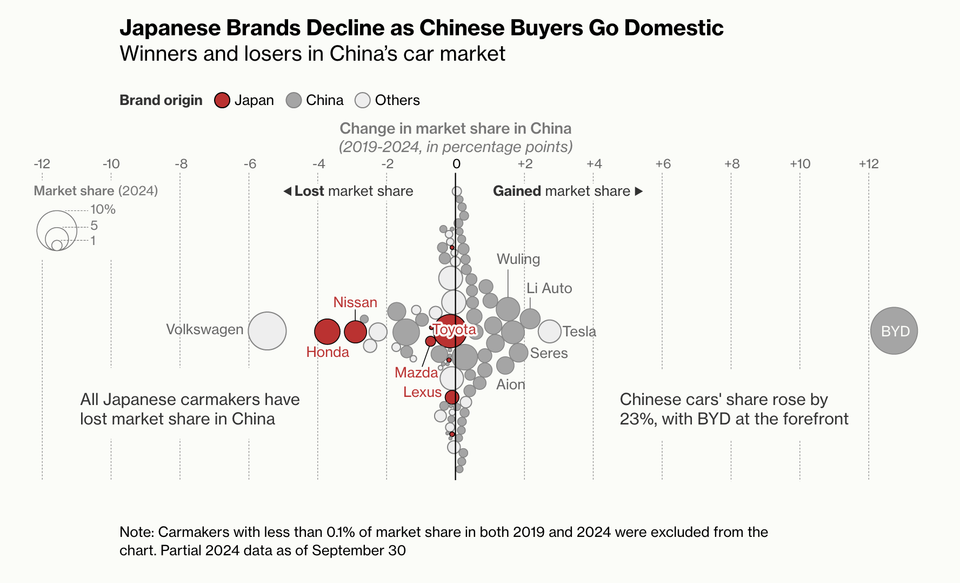
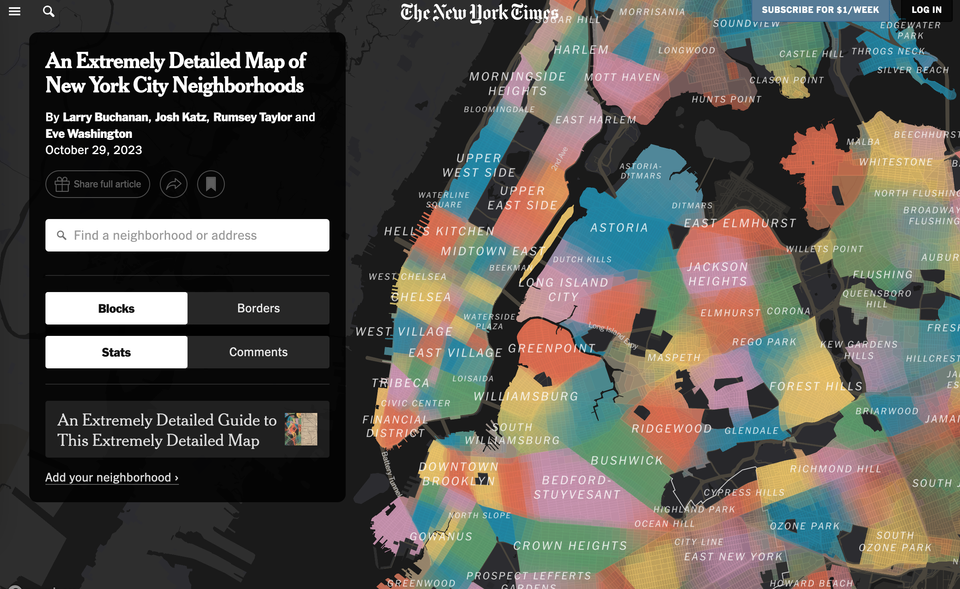
Clustering

Prime visual story-telling

Kaiser appreciates this wonderful example of visual storytelling.
Read More
Page 1 of 1
Junk Charts © 2026
  • BOOKS
  • COURSES
  • PRESS
  • CONSULTING
  • COACHING
  • CONTACT
Powered by Ghost