The plural of anecdote is not ...

One of my favorite statistics-related wisecracks is: the plural of anecdote is not data.
In today's world, the saying should really say: the plural of anecdote is not BIG DATA.
In class this week, we discussed a recent Letter to the Editor of top journal, New England Journal of Medicine, featuring a short analysis of weight data coming from a digital scale that, you guessed it, makes users consent to being research subjects by accepting its Terms and Conditions. (link to NEJM paper, covered by New York Times)
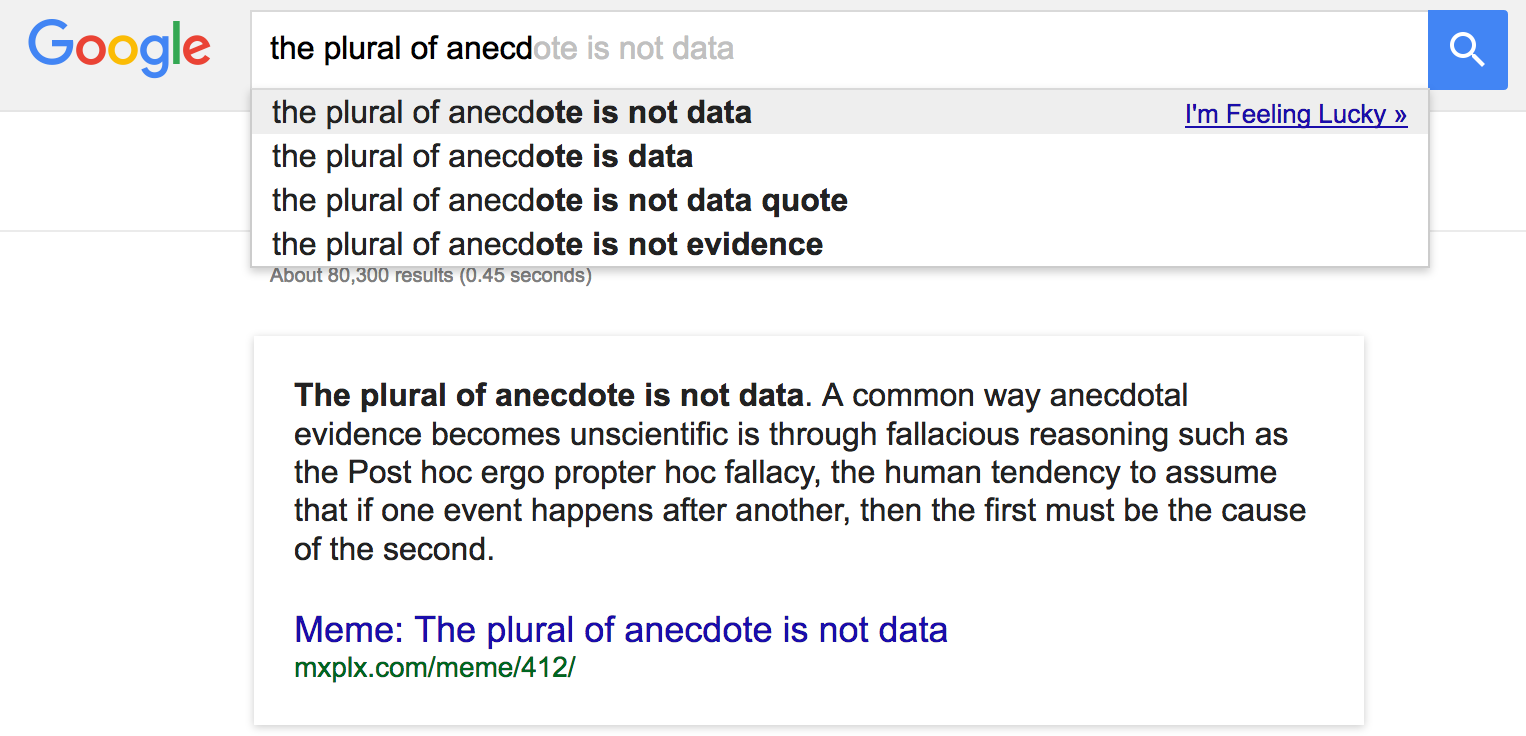
The "analysis" is succinctly summarized by this chart:

Their conclusion is that people gain weight around the major holidays.
How did the researchers come up with such a conclusion? They in essence took the data from the Withings scales, removed a lot of the data based on various criteria (explained in this Supplement), and plotted the average weight changes over time. Ok, ok, I hear the complaint that I'm oversimplifying. They also smoothed (and interpolated) the time series and "de-trended" the data by subtracting a "linear trend". The de-trending accomplished nothing, as evidenced by comparing the de-trended chart in the main article to the unadjusted chart in the Supplement.
Then, the researchers marked out several major holidays - New Year, Christmas, Thanksgiving (U.S.), Easter, and Golden Week (Japan) - and lo and behold, in each case the holidays coincided with a spike in weight gain, ranging from a high of about +0.8% (U.S.) to a low of +0.25% (Easter).
Each peak is an anecdote and the plural of these peaks is BIG DATA!
Why did I say that? Look for July 4th, another important holiday in the States. If this "analysis" is to be believed, July 4th is not a major holiday in the U.S. On average, people tend to lose weight (-0.1%) around Independence Day. There is also no weight change around Labor Day.
In a sense, this chart shows the power of data visualization to shape perception. Labeling those five holidays draws the reader's attention. Not labeling the other major holidays takes them out of the narrative. Part of having numbersense is to have ability and confidence to make our own judgment about the data. Once one notices the glaring problems around July 4th and Labor Day, one no longer can believe the conclusion.
There is also "story time" operating here. The researchers only had data on weight changes. They did not have, nor did they seek, data on food intake. But the whole story is about festive holidays leading to "increased intake of favorite foods" which leads to weight gain. Story time is when you lull readers with a little bit of data, and when they are dozing off, you feed them a huge dose of narrative going much beyond the data.
The real problem here relates to the research process. Traditionally, you come up with a hypothesis, and design an experiment or study to verify the hypothesis. Nowadays, you start with some found data, you look at the data, you notice some features in the data like the five peaks, you now create your hypothesis, and there really is little need to confirm since the hypothesis is suggested by the data. And yet, researchers will now run a t-test, and report p-values (in this weight change study, the p-values were < 0.005.)
Even if it's acceptable to form your hypothesis after peeking at the data, the researcher should have then formulated a regression model with all of the major holidays represented, and then the model will provide estimates of the direction and magnitude of each effect, and its statistical significance.
PS. Some will grumble that the analysis is not "big data" since it does not contain gazillion rows of data, far from it. However, almost all Big Data analyses that are done following the blueprint outlined above. Also, I do not define Big Data by its volume. Here is a primer to the OCCAM definition of Big Data. Under the OCCAM framework, the Withings scale data is observational, has no controls, is treated as "complete" by the researchers, and was collected primarily for non-research reasons.
PPS. Those p-values are hilariously tiny. The p-value is a measure of the signal-to-noise ratio in the data. The noise in this dataset is very high. In the Supplement, the researchers outlined an outlier removal procedure, in which they disclosed that the "allowable variation" is 3% daily plus an extra 0.1% for each following day between two observations. Recall the "signals" had sizes of less than 0.8%.