The way of the statistician
It wasn't that close after all
What do statisticians do? A lot of people seem not to know.
If you are curious to know, try reading Andrew's post about Tuesday's local elections in the U.S. (link) Living in the northeast, we were served a flurry of late-breaking reports, claiming that the New York City mayor's race was tightening (link), and the New Jersey governor's race was a toss-up (link, link). Andrew's analysis would suggest comfortable wins for the Democratic candidates in each case; and since I'm writing this post after polls closed, I can report that his findings weren't far from the actual outcomes.
How did Andrew determine that the Democratic candidate in each case has around 80-90% chance of winning?
The starting point are poll numbers. People are asked which candidate they intend to vote for in each election. This data are then converted into vote shares. There are multiple pollsters, and each runs periodic polls so we have a dataset consisting of a series of vote share values for each candidate in each election.
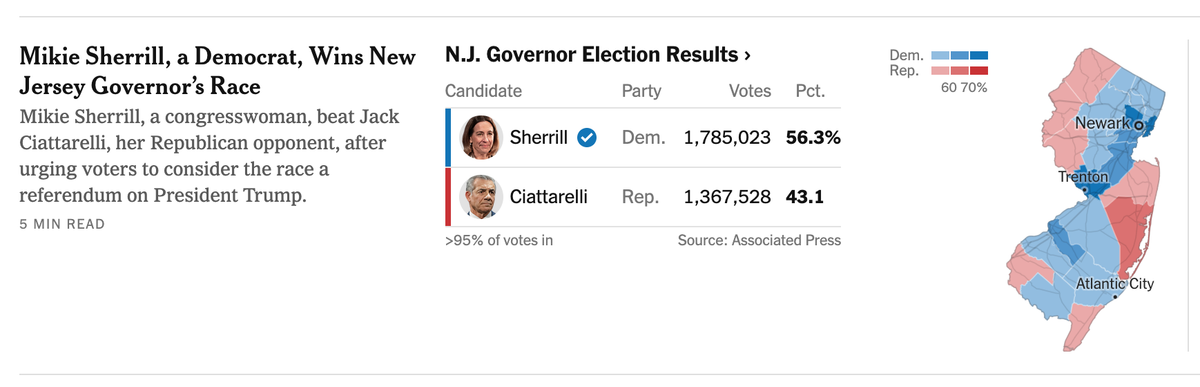
Here is New Jersey Democrat Mikie Sherrill's vote-share series: 56%, 51%, 51%, 54%, 55%, and 55%. Each value came from a different poll. The average vote share is 53%. Crudely, one predicts that Sherrill will win 53% of the election-day votes.
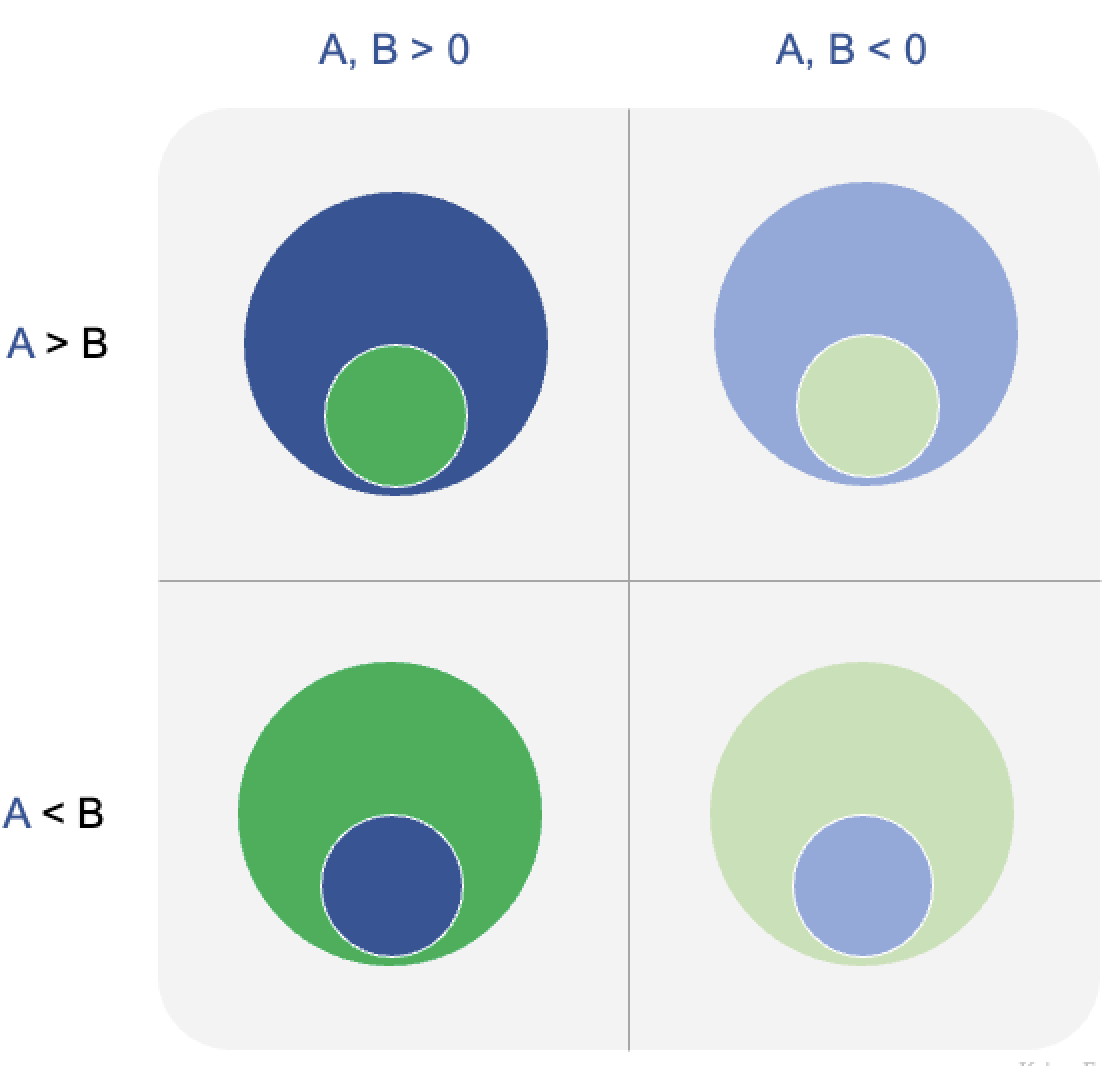
Statisticians don't like that answer. A moment's thought should convince you that the ability of prior polls to predict the election outcome depends, in part, on the variability in that vote-share series. Two of the six values sit uncomfortably close to 50%. How do we capture this observation quantitively?
The canonical tool used by statisticians is the margin of error. Here, it's ±4.4%. (This number is derived from the standard deviation of the vote-share data series.) Notably, the left side of the margin of error dips below 50%.
On election day, Sherrill needs at least 50% of the votes to win. How likely is she to get half or more of the votes, given the series of poll numbers averaging 53%? We now appeal to the statistics gods.
The gods tend to a pool of "truth". The prior polls are random samples of this truth. Since they didn't measure every likely voter, each polling sample is different, so the series of polling averages exhibited variability. The margin of error quantifies such uncertainty: the probability that a poll average falls within 49.6% and 57.4% is 95%.
That doesn't directly answer our question. Using the same tools, we can show that there is 91% chance of obtaining a sample average of 50% or higher. In other words, the New Jersey Governer's election is not a toss-up as the media led us to believe.
Andrew also explained why he lowered Sherrill's chance to 84%. The margin of error only accounts for sampling variability – think of it as random error. As recent elections have shown, polls also suffer from systematic error, that is to say, some other factor causes most polls to skew in the same direction. Andrew modeled this source of error by adjusting the margin of error upwards, to ±6%, which leads to a downward revision of her winning probability. (She won handily with 56% of the votes, at the time of writing.)
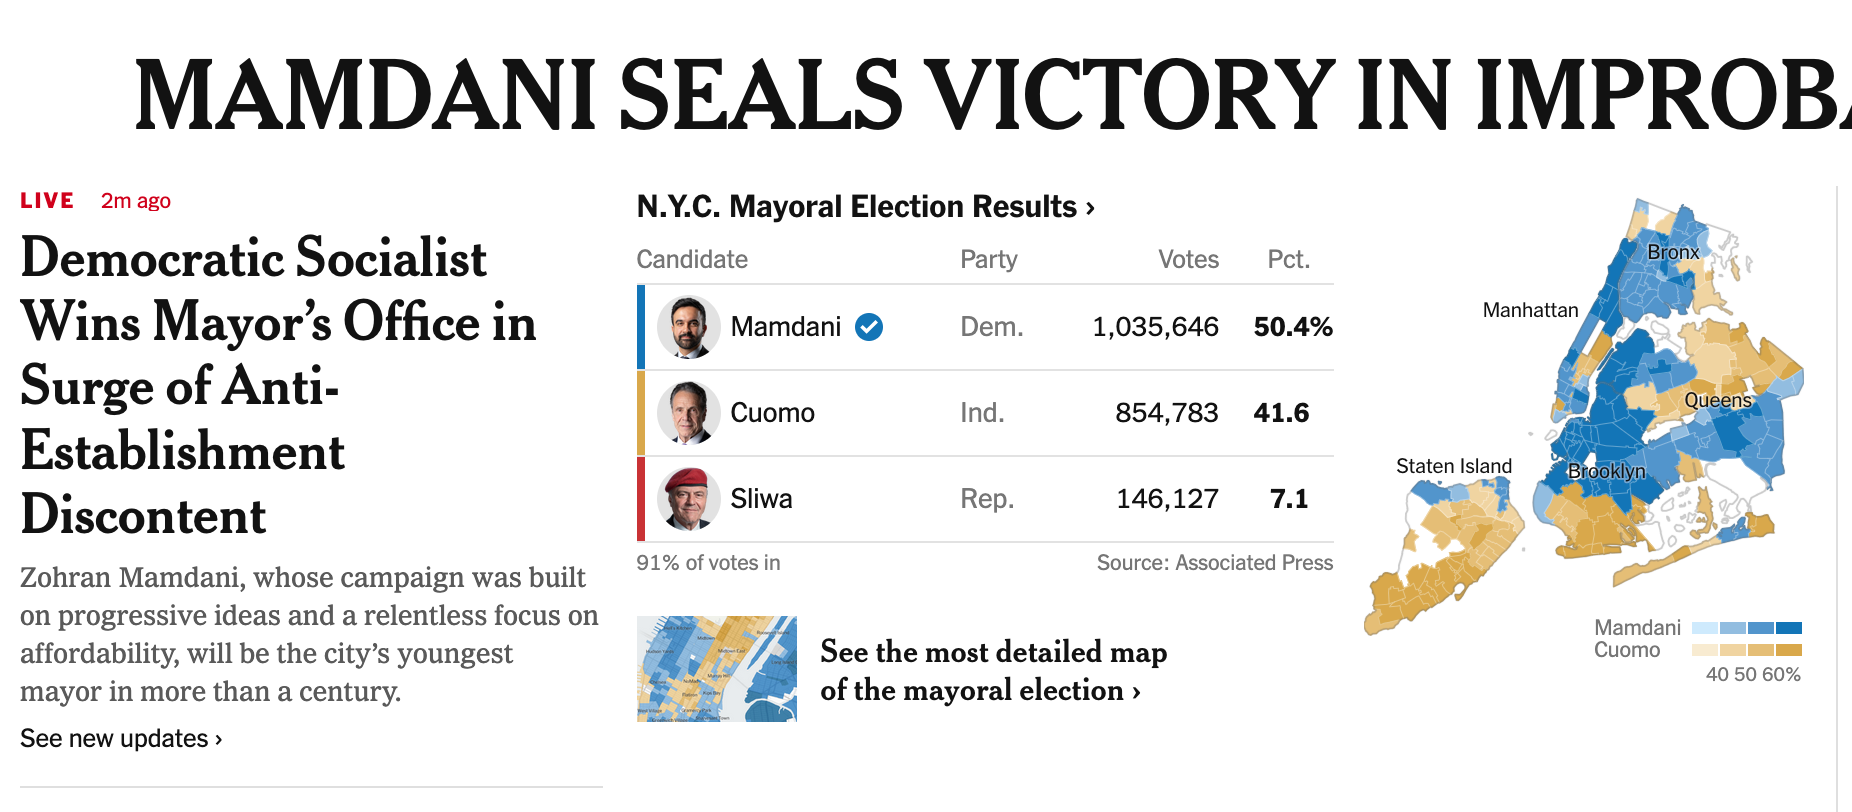
For the NYC mayor election, Andrew gave several reasons why he lowered Mamdani's chance of winning futher. This election is a three-way race, while the above methodology uses the two-candidate vote shares, ignoring the Republican candidate's values. It's reasonable to assume that on election day, some of the voters who had intended to vote for the Republican would decide not to waste their vote, and most of them were expected to gift their votes to Cuomo.
By making assumptions about the size of this group of late switchers, and the amount of skew towards Cuomo, we can adjust the expected two-candidate vote shares between Mamdani and Cuomo. This maneuver only moved the average vote share by a couple of percentage points (because the Republican weren't going to get that many votes). Even after inserting more uncertainty to account for more variability in a three-horse race, Andrew's analysis still shows Mamdani's chance of winning to be over 86%.
The prediction market Kalshi was heavily advertising at the bus stops in NYC last week. These displays consistently showed Mamdani's winning probability in the 80-90% range. As Andrew indicated, since the people betting on these markets had access to the same polling data, it's not surprising they arrived at a similar place.
There are some details I and/or Andrew shoved under the rug but these minor items need not bother anyone except statisticians.
For example, we effectively treated the values in each vote-share series as a different "random sample" from an underlying population. One can complain that these are non-random samples due to different pollsters, and different polling periods.
Another complaint may be that the series of polls is too short, only about six values per race. One can, in theory, fetch a longer series but there is a trade-off; polls conducted far from the election day are generally less reliable, and the further back, the more unreliable.
We used an "empirical" estimate of the sampling variability by computing the variability of the series of numbers. As the series is short, this estimate is error-prone. Nevertheless, it's better than the so-called "parametric" alternative, which results in a severe underestimate of the uncertainty. (This parametric estimate arises from a theoretical model.)
Finally, all steps above require assumptions. If one uses a different guess of how many Republican voters would shift their vote to Cuomo, the estimated vote shares would have been different. When it comes to assumptions, what's certain is that not making assumptions is the worst possible strategy. In this case, not making assumptions is the same as assuming that no Republican voters would vote for Cuomo.