Maps of red-blue splits
How tech makes everything possible
Reader Kristen P. came across a data visualization of Minnesota's midterm election results on social media (link).
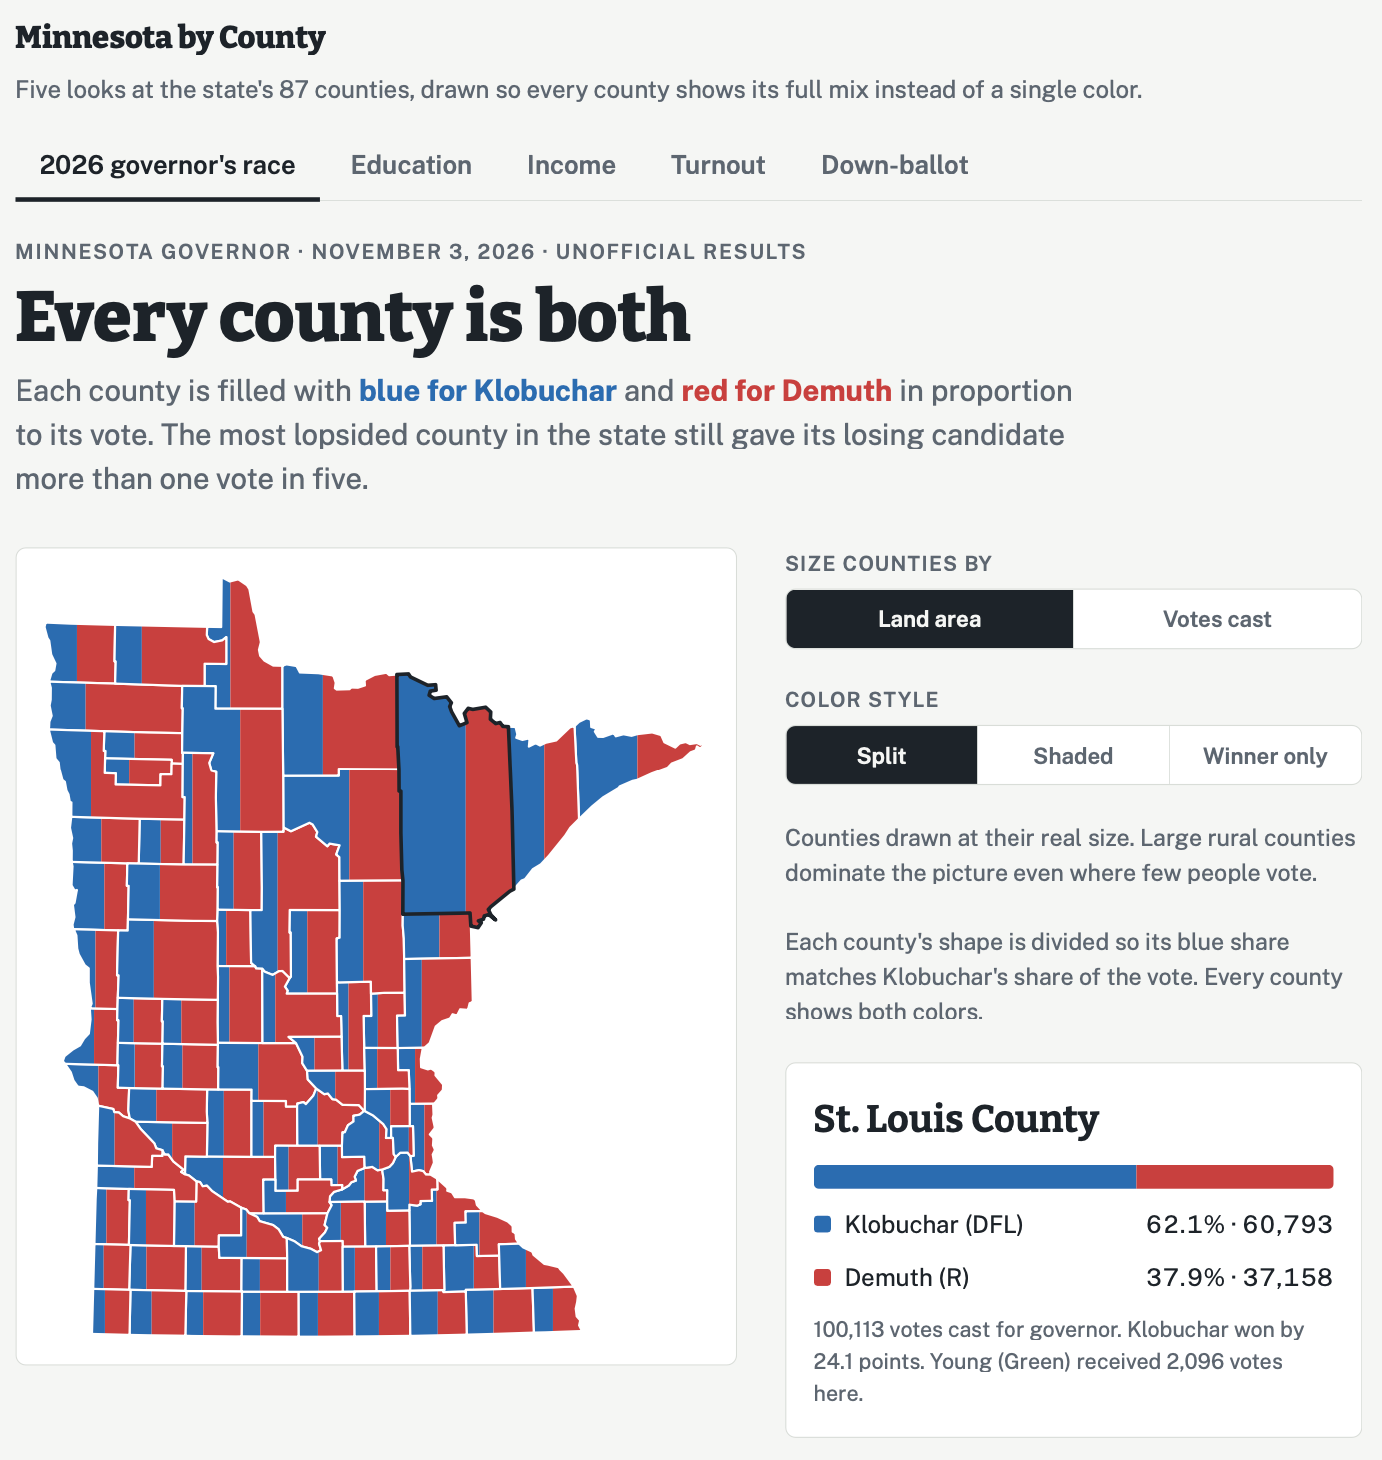
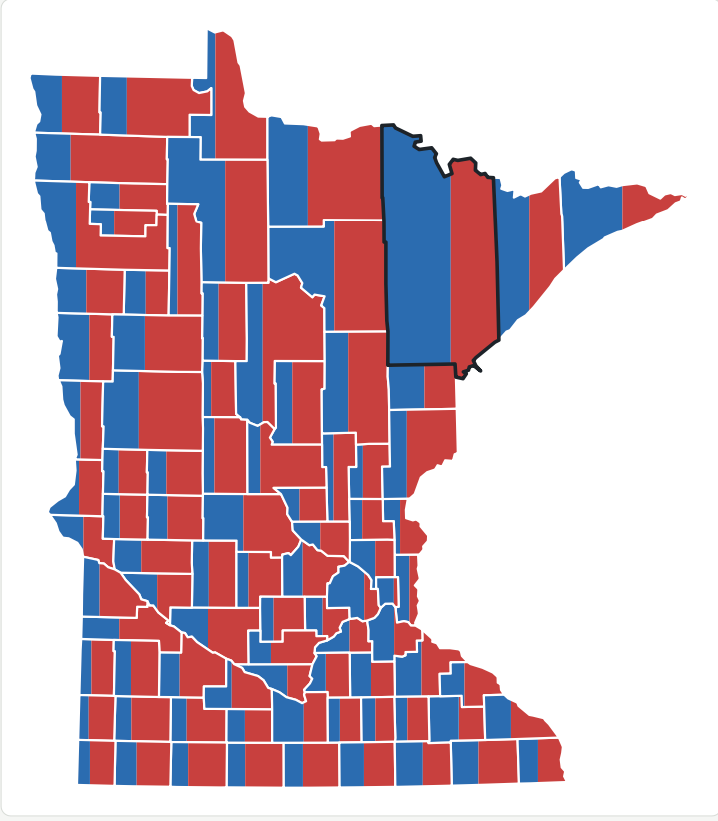
The project focuses on the governor's contest, which pitted the Democrat Amy Klobuchar against the Republican Lisa Demuth. The headline map is a set of thinly-disguised bar charts. The overall result (found here) is a Democratic Party victory, 55.5% vs 42.6% (a winning margin of ~13%).
I had to look up the results because I can't infer them from the map. That is a frequent issue with graphics showing granular data; the big picture is lost.
It might be easier to visit the "boring" statistical graphic at the bottom of the page first, to get an idea of the dataset behind this project.
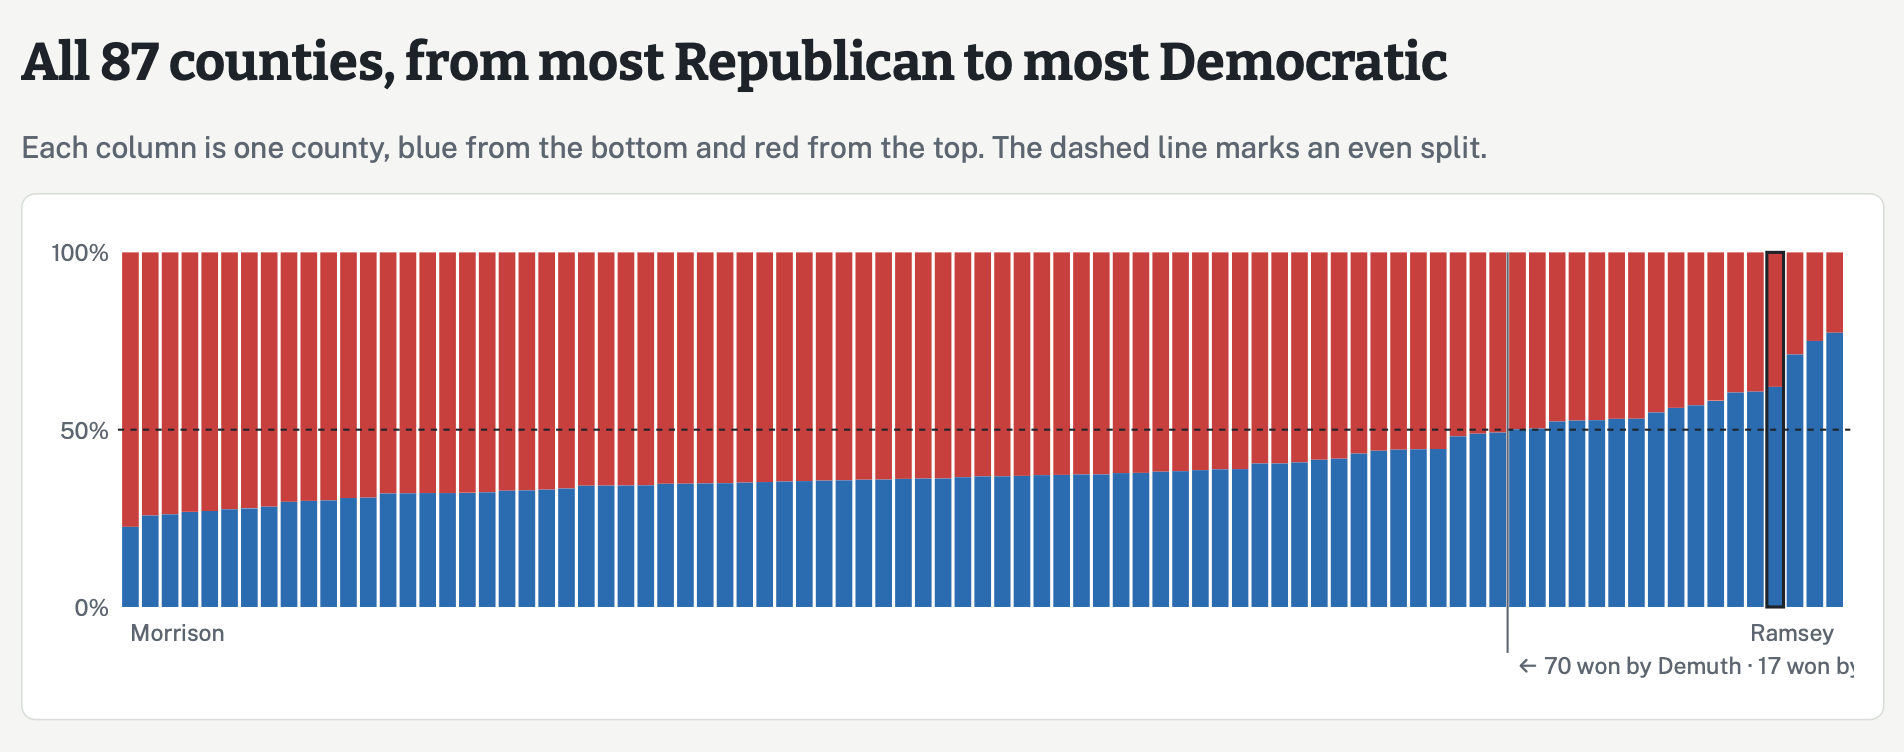
Minnesota consists of 87 counties. The vertical axis labels display the proportion voting for the Democrat, which are the blue bars (reading red bars requires work). Imagine a 55% line above the 50% line; that's the state-wide proportion. Not unexpectedly, Klobuchar lost in the vast majority of counties but won in the most populous counties (a fact you can't tell from this proportional bar chart).
To get vote splits, this bar chart is much more efficient than the map shown above. That's because every bar is on level ground, the shape is fixed, and the data are encoded strictly in the bar heights.
There is an interesting story lurking behind this project, that of technological innovation.
The entire project is made by Claude. We don't know who the human steerer is but the Claude hosts this "artifact".
The AI platforms have made it possible for anyone to put up competent data visualizations like this one. That's a benefit to society.
The same capability will surely put many consultants out of a job; and if they luckily survive this wipeout, the nature of work will have been transformed.
Let's now return to the proportional-area map discussed above. In pre-AI years, few of us would attempt to make such a map. It's just too complex to figure out where to place the vertical line that accurately splits red and blue. With current technology, anyone can make such a chart. The AI can call up computer tools that measure the precise area of those irregularly shaped polygons, and place dividing lines at carefully computed locations.
Even though we can now produce such maps doesn't mean we should. Even if AI correctly places 87 dividing lines that precisely divide the county areas according to the vote share data, humans simply don't have the capability of judging area partitions in irregular shapes.
AI makes it easy to make an impression, and even easier to make a mess.
With AI, one can efficiently put up alternative visualizations. The projcet includes many sets of related maps. Here is another one:
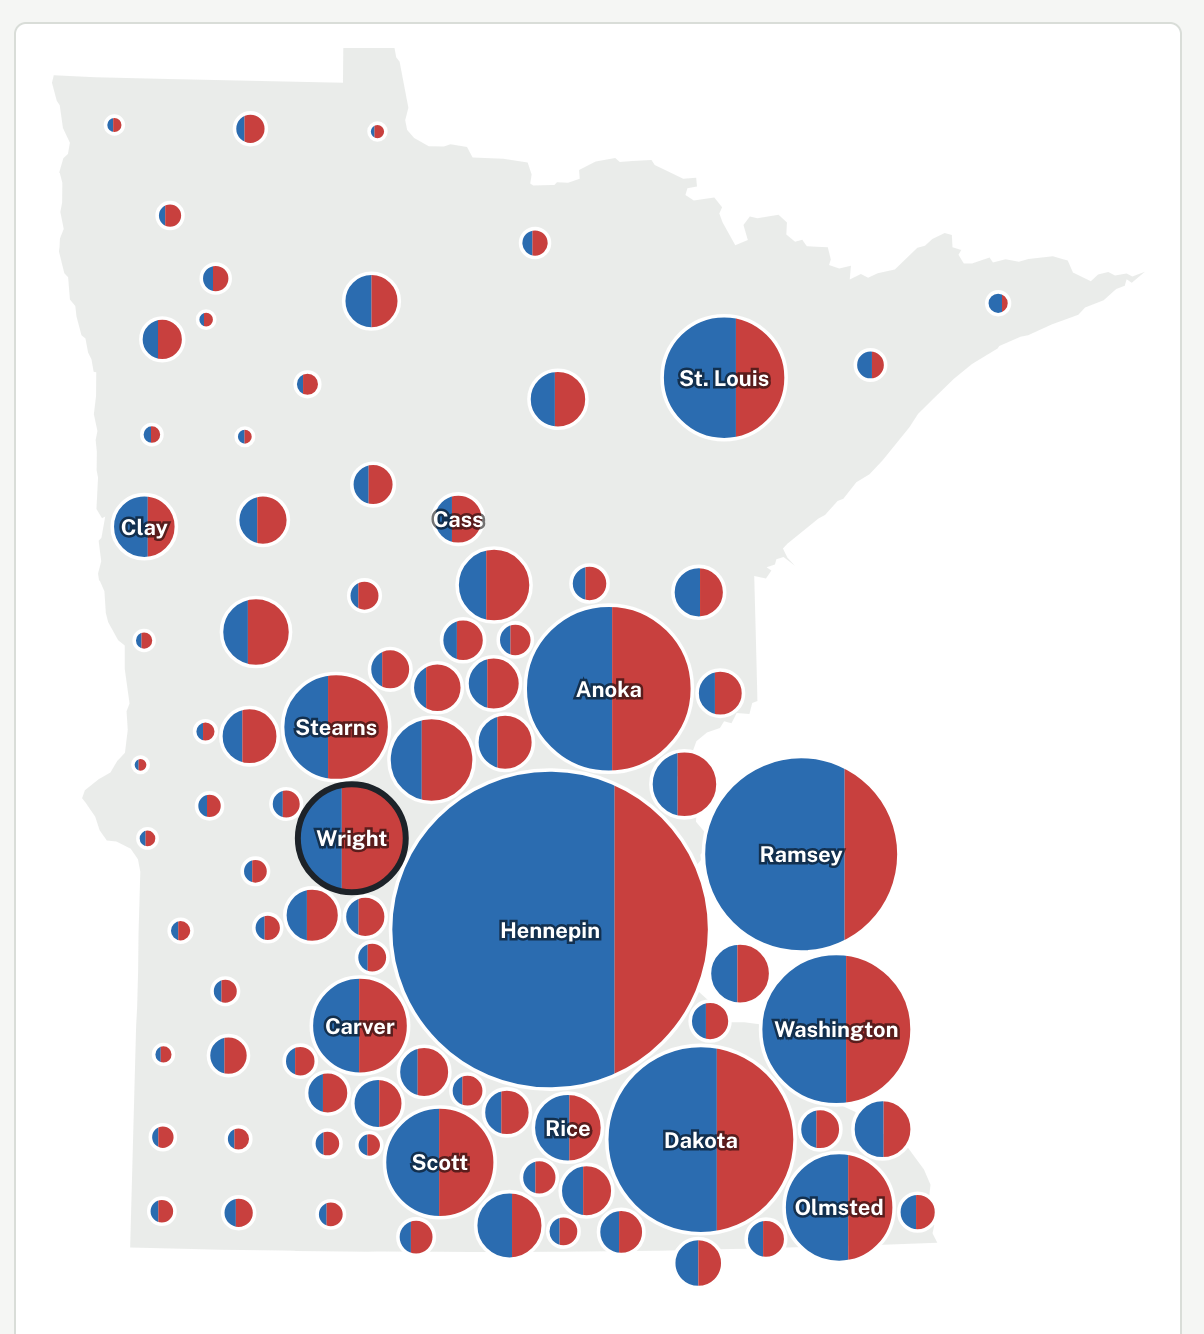
This split-pie version is mostly the same as the first chart. Instead of coding the data into the land area, this version encodes the total number of votes cast into the pie sizes, and the vote splits into split areas.
On this map, we learn that the Democrats did well in the more populous counties. I find it challenging to estimate what the blue vote share is for Hennepin (or most other) county. I want to say it's two-thirds of the total area but apparently it's three-quarters.
There is a crucial difference between the two maps. In the pie-chart version of the map, the total blue area across all pies should encode the total number of Democratic votes cast. This is because the pie size is controlled by the number of votes cast. In the county-area version of the map, the county size is an exogenous input, having nothing to do with election data. Thus, the sum of the blue parts on that map does not represent what we expect.