Aligning the data and the visual
Exploring a nice data viz project
A student of a former professor of mine created a nice data visualization project (link).
The raw data look like this:
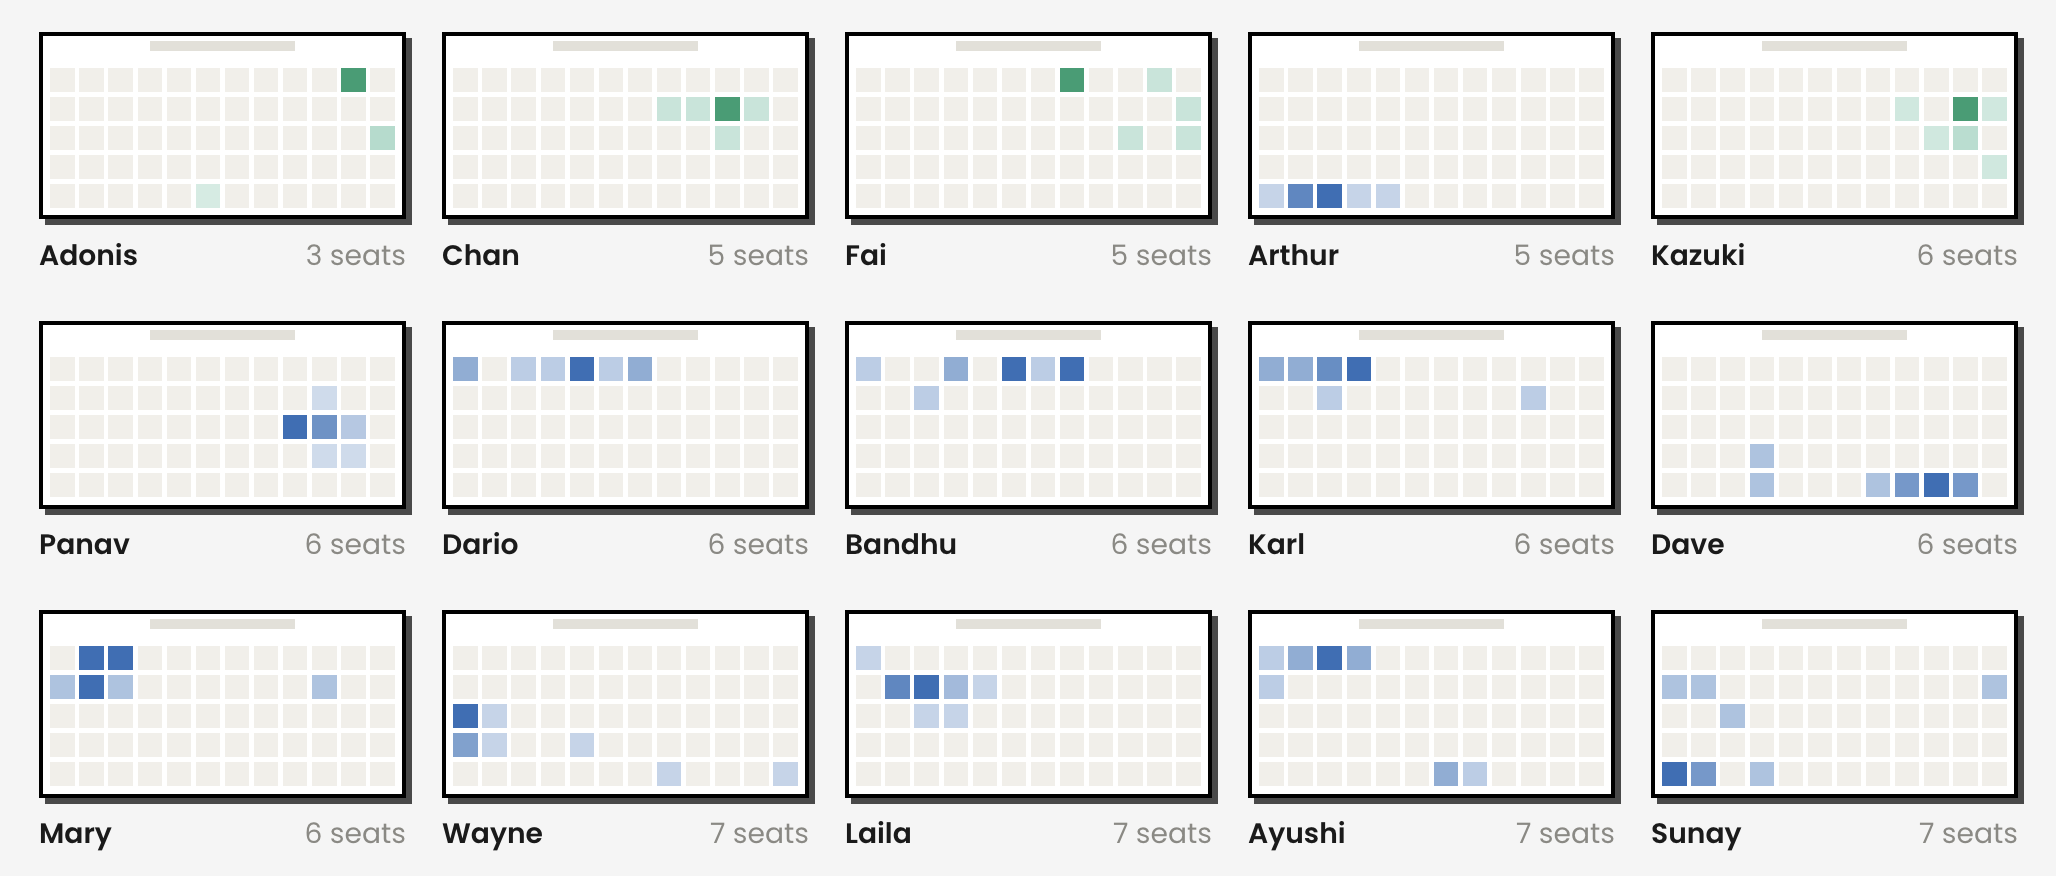
These are seating preferences of MIT students in a particular class. The dataset is actually larger than these 15 students; I clipped the rest.
The classroom is a rectangle, and seat locations are fixed and clearly defined. I'm a bit surprised at the number of different locations for each student. I'd have expected that most students stick to a specific seat. The tint of the color seems to be the frequency of occupancy so the cell with the darkest color is the "mode" of the distribution.
Arthur, for example, was always found in the back row, on the left side of the room while Fai and Kazuki preferred the right side in the front rows.
The designer adopts a succinct style. There are no legends or text describing how to interpret the visual but I think the readers can competently perceive what the tints mean.
The individual details are nice, but a story they don't make. The designer's job then is pattern recognition. Going from individual students to subgroup patterns. The analysis here divides students into three subgroups based on seating behavior: prefer a single seat (green); prefer a single zone (blue); jump around (orange). The subgroup colors are shown in a legend (which I omitted in the excerpt above).
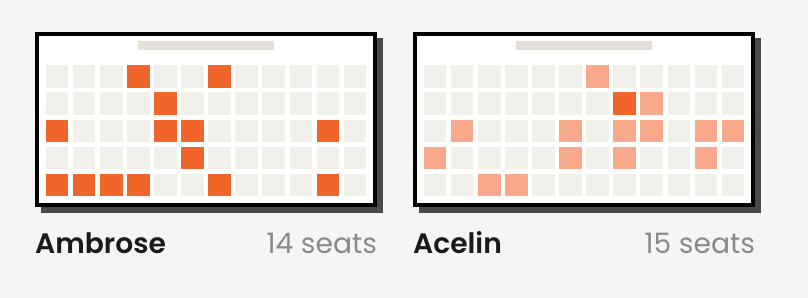
This classification is driven by one underlying factor – the amount of variability in the seat locations. Orange tiles have the greatest variability while green tiles show the least. See these orange examples:
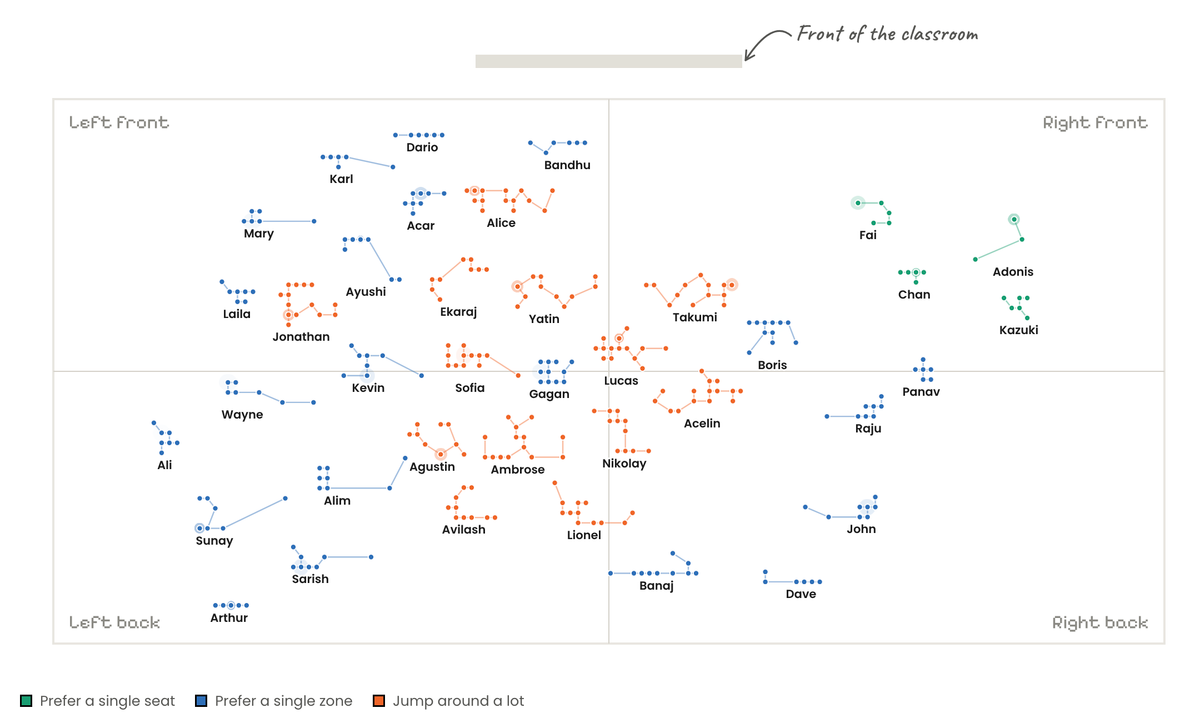
The designer reformats the above panel of charts into this attractive visual:
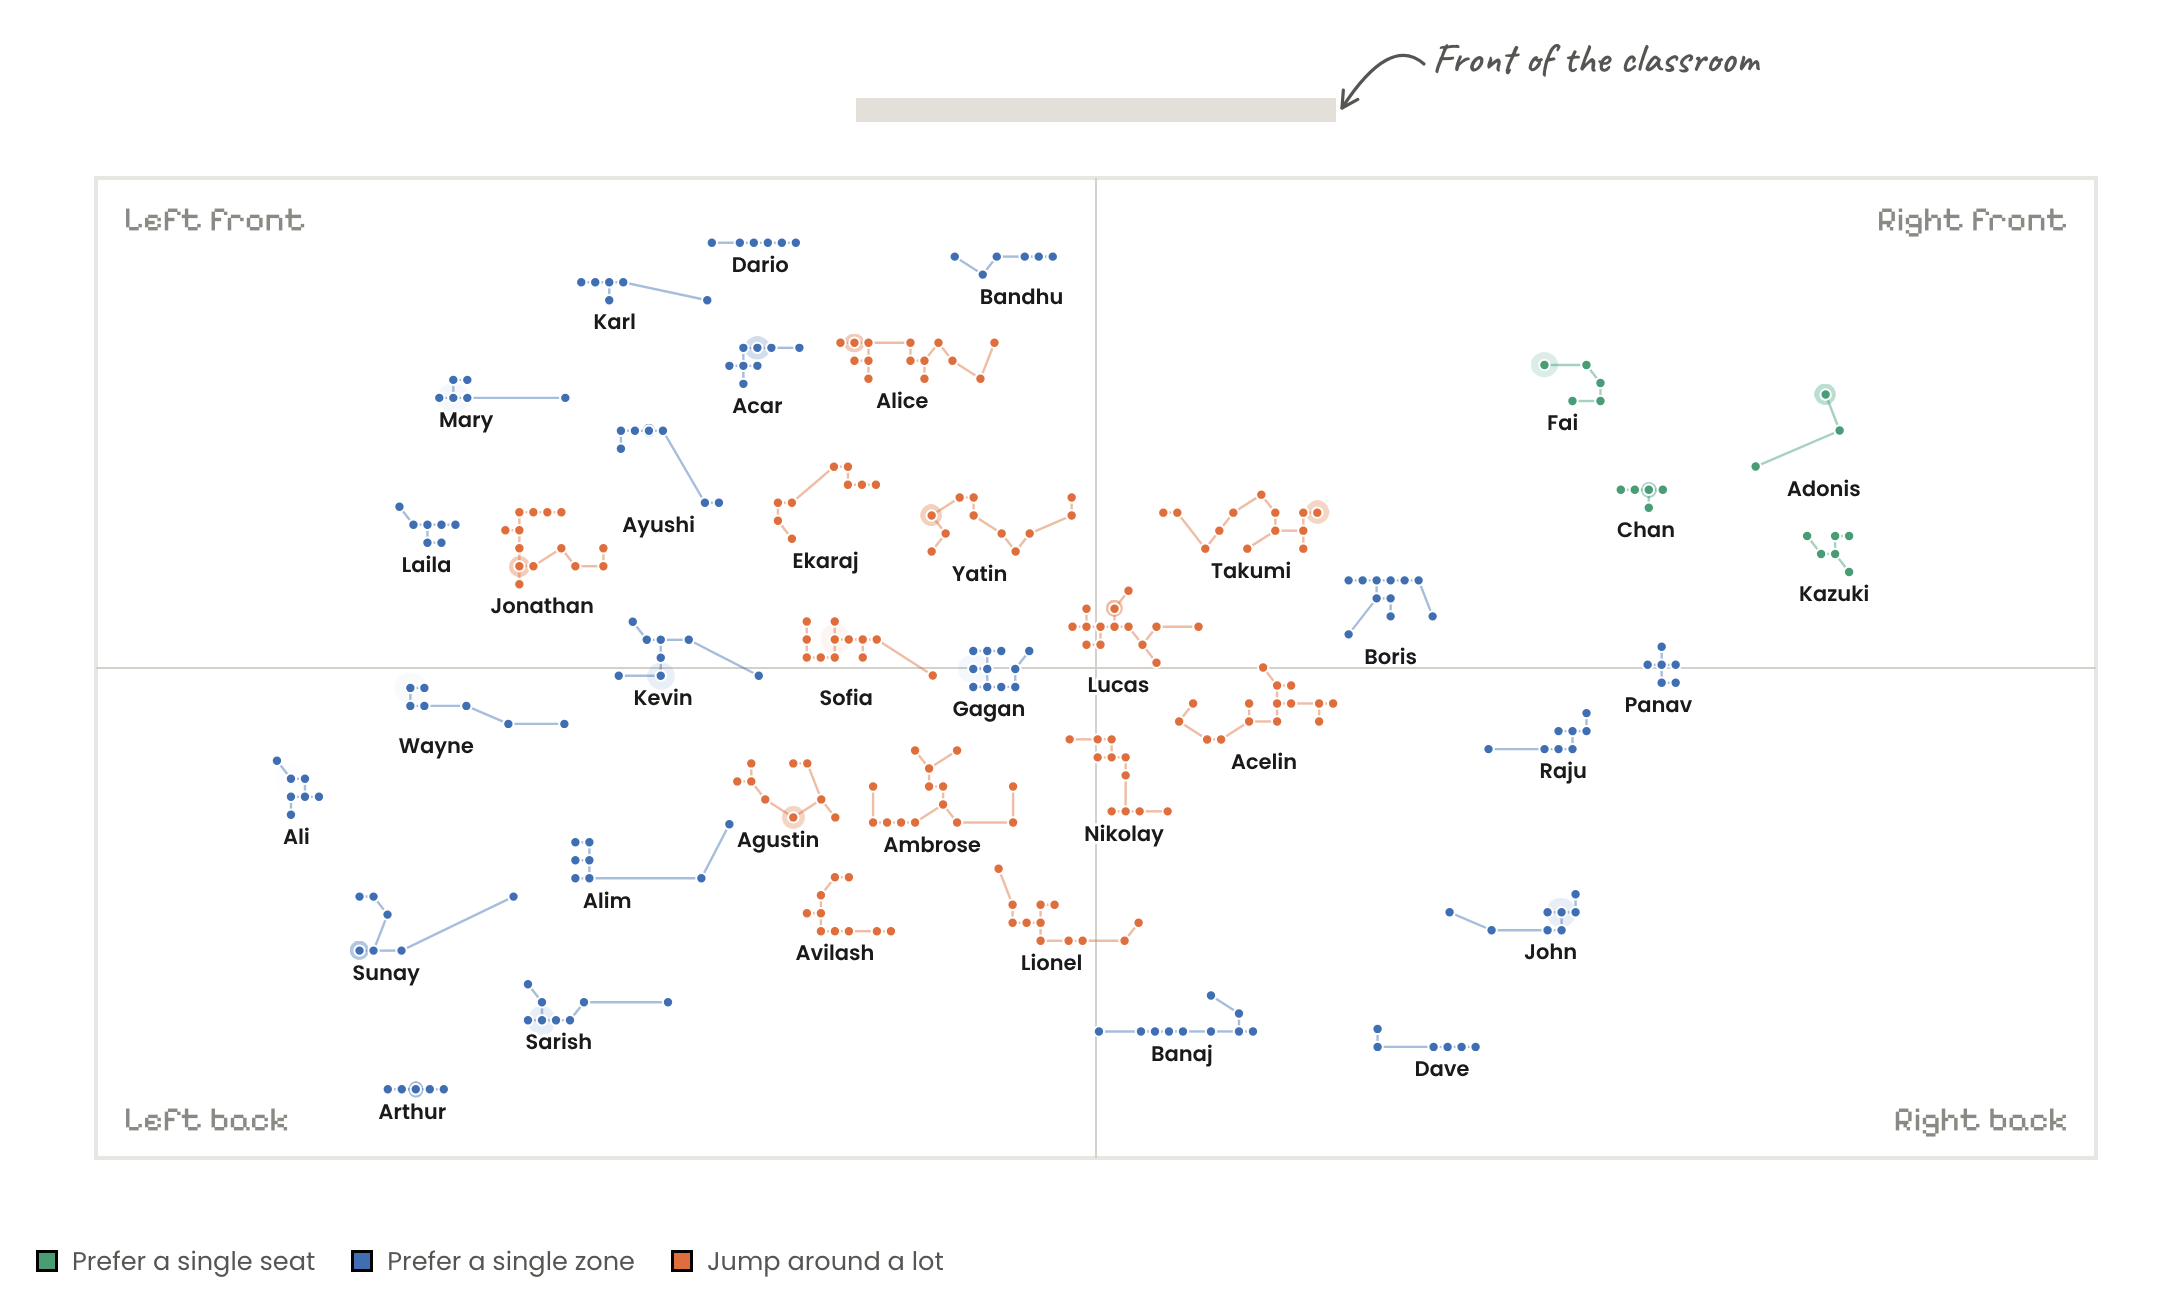
Perhaps it's inspired by the "tile map".
Each student's "tile" is centered probably at its mode. The background context of the seat locations has been removed. The seat locations per student are connected by edges, which is more artistic than informative. There is a time series behind the dots although that information is not utilized here.
This visualization focuses our attention on the representative location for each student. Every student is represented by a tile of the same size. In doing so, the visual design deemphasizes the degree of variability of these locations.
The orange subgroup are all found in the middle, leaning left. The blue subgroup appear to encircle the orange tiles. It's unclear why the orange tiles are orange, or the blue ones blue, because the variability information is subdued. From the earlier description, we know that the students in orange "jump around" while those in blue stay within a zone.
In a Trifecta Checkup analysis, the underlying issue is a small misalignment between what the visual is saying and what the data are saying. Ideally, the design visually displays the higher variability of locations in the orange subgroup vs the blue subgroup vs the green subgroup.
I like the visual style, and the creativity expressed in the designs.
For a project like this, the key challenge is the Q corner: what's a practical question for which the dataset provides a good answer?