Abstractions in data viz
New paper with Andrew Gelman

Happy to report that another paper of mine has just appeared. This paper is primarily Andrew Gelman's work, for which I applied some finishing touches.
The paper is called "The Ladder of Abstraction in Statistical Graphics" (American Scientist).
It concerns a topic that is under-researched. How should we compose a visual story that utilizes a sequence of charts? This goal differs from the objective of how we compose a single chart that tells the entire story.
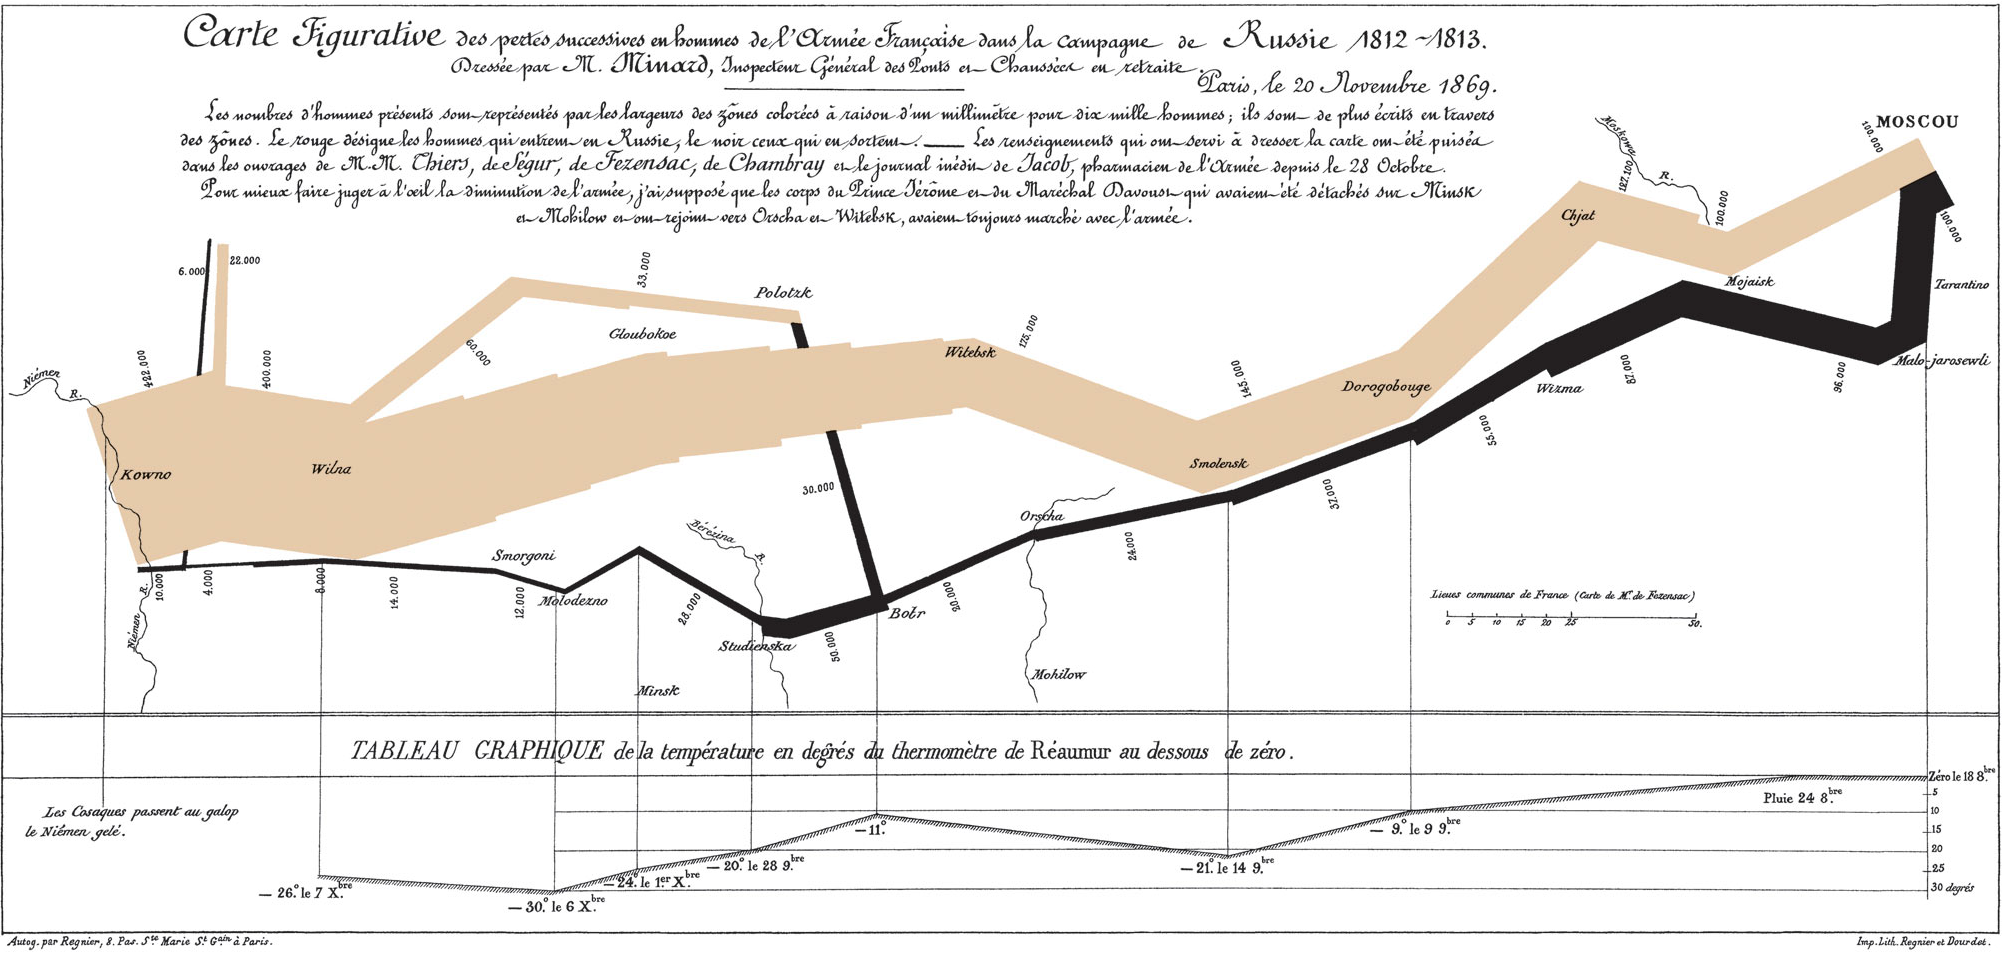
Like many, I appreciate single charts that tell the whole story. Minard's illustration of Napoleon's Russian campaign is a famous example. Constructing such a chart forces the designer to distill a lot of information to their essence. It forces the designer to edit.
But when the problem is complex enough, a single chart cannot do full justice. Take this common situation: you have a finding about metric A's correlation with some variable. Metric A is not directly measured but an output of a complicated process. The chart's reader must comprehend the process in order to understand metric A. You'd most likely require more than one chart.
Once you move from one chart to a set of charts, a host of issues arises. Our paper grapples with these issues. In particular, we recommend starting with more concrete concepts and progressively moving to more abstract ones. We don't have all the answers and we hope others will contribute to this important line of research.