Notes on Webby nominees
Which data visualization project is best of the year?

Long-time reader Chris P. asked me about the Webby Awards nominees for best data visualization (link). The award is open to voting right now.
There are five contenders for the Webby Award. I’ll give some thoughts in the order they appear on the website. I’ll post more detailed commentary in future posts.
Sources of U.S. imports – Reuters (link)
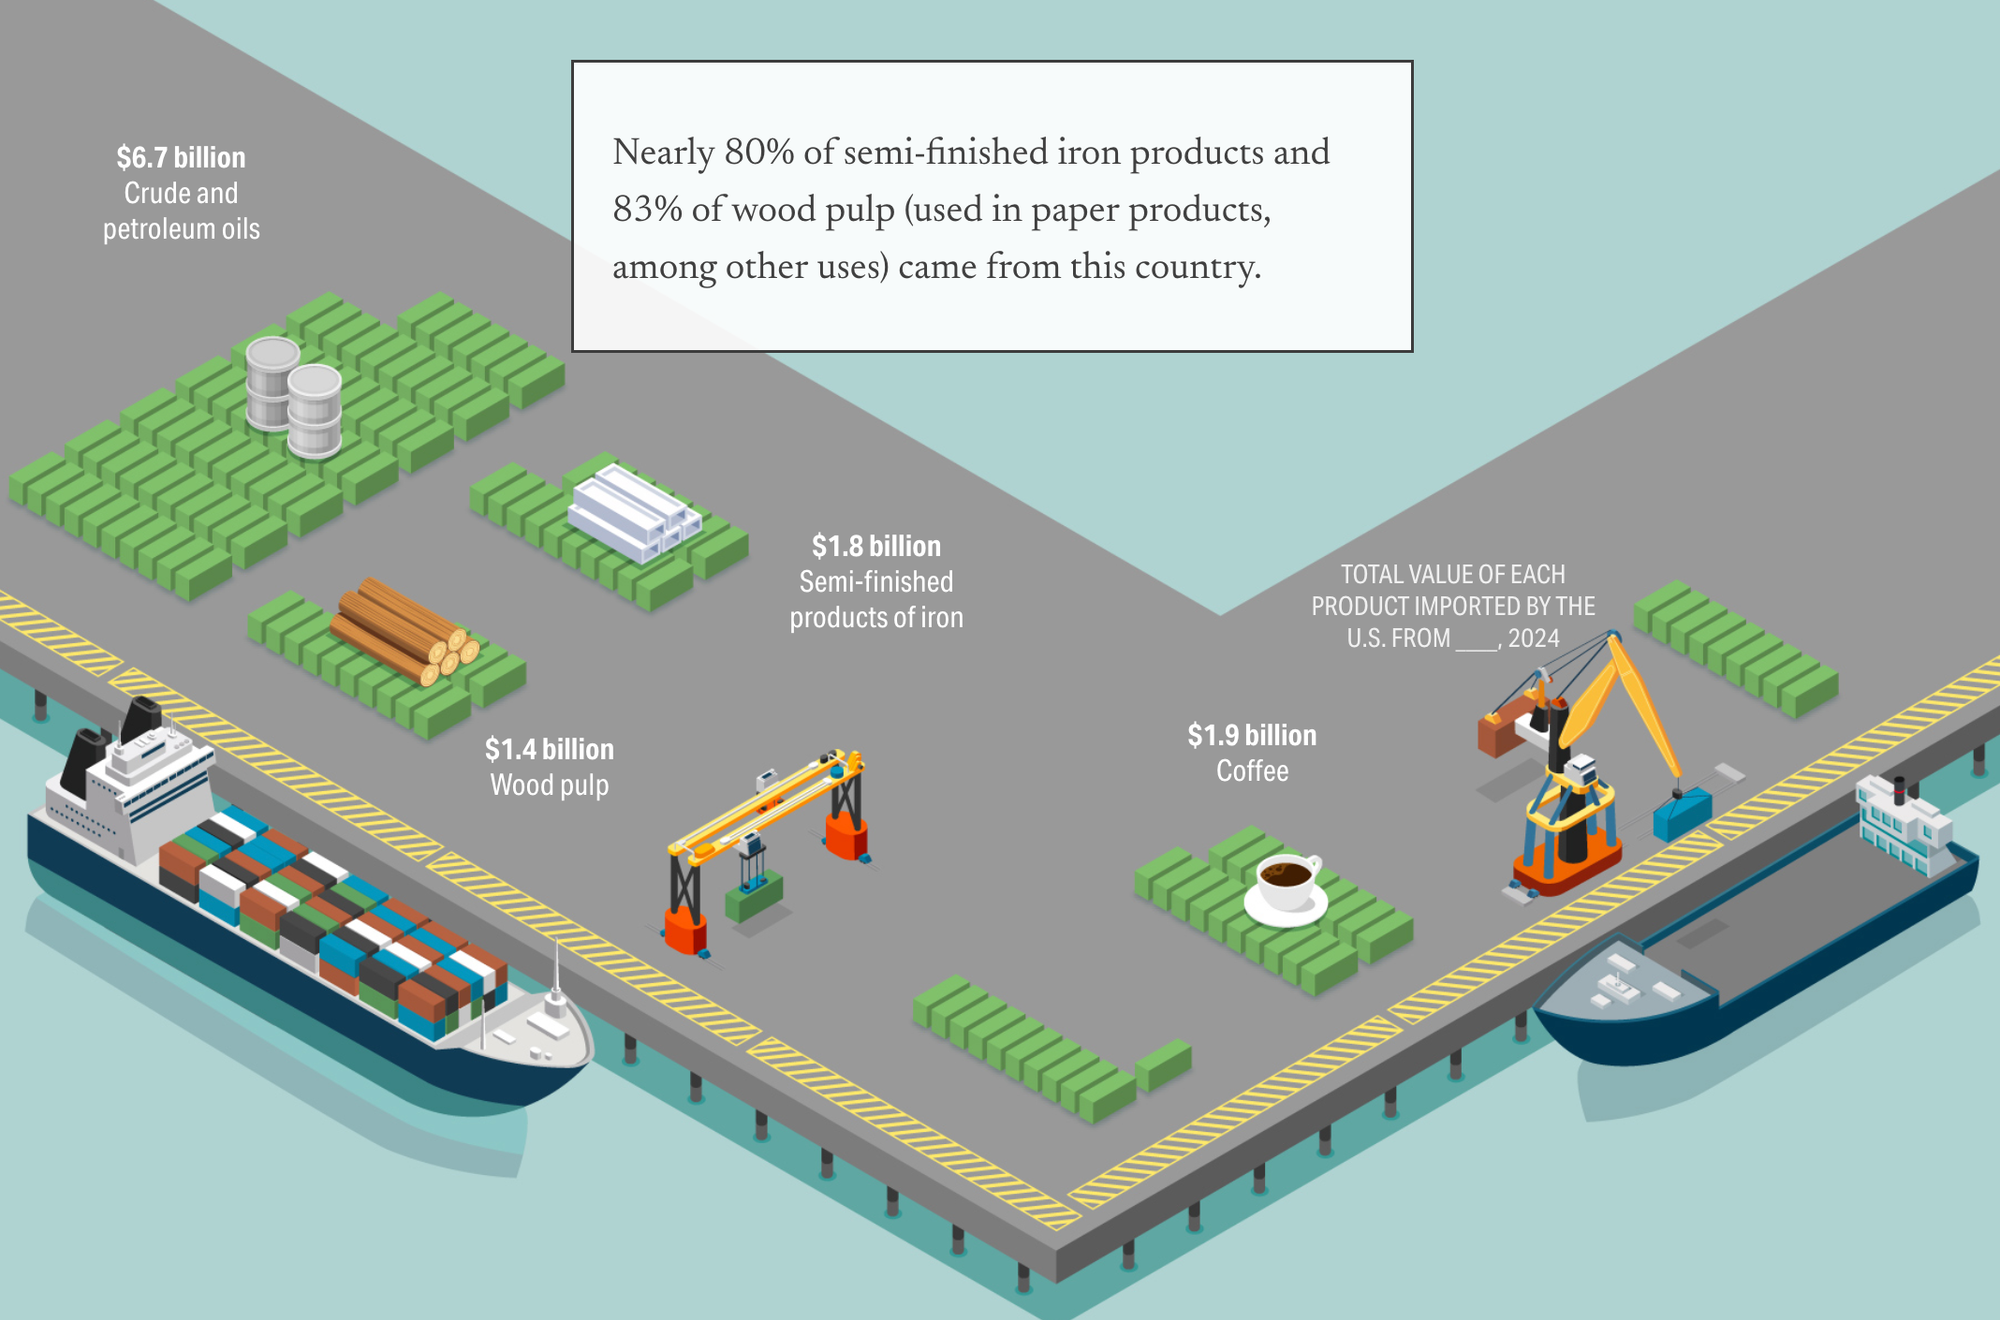
This project addresses the question of where Americans get imported goods from. Some of the answers are quite surprising, if you aren’t a trade economist. The designers engage the audience by casting the project as an interactive quiz: after presenting the types of goods the U.S. imports from a particular country, the reader is asked to guess the country. The illustrations convey a sense of light-hearted fun. The data graphics skew toward visual appeal, sacrificing clarity. What impress me the most is the quality of editing: they do not show every bit of data they collected. They focus on several major categories of imports that everyone can relate to, such as food, medicine, and electronics.
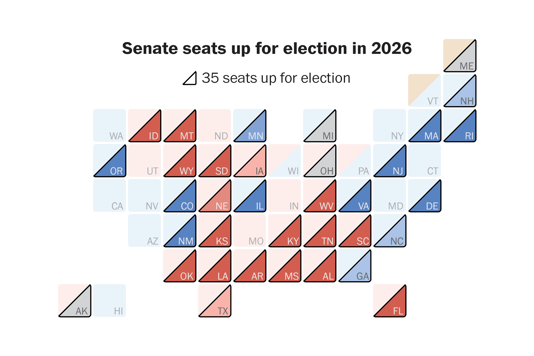
Birds – Visual Cinnamon (link)
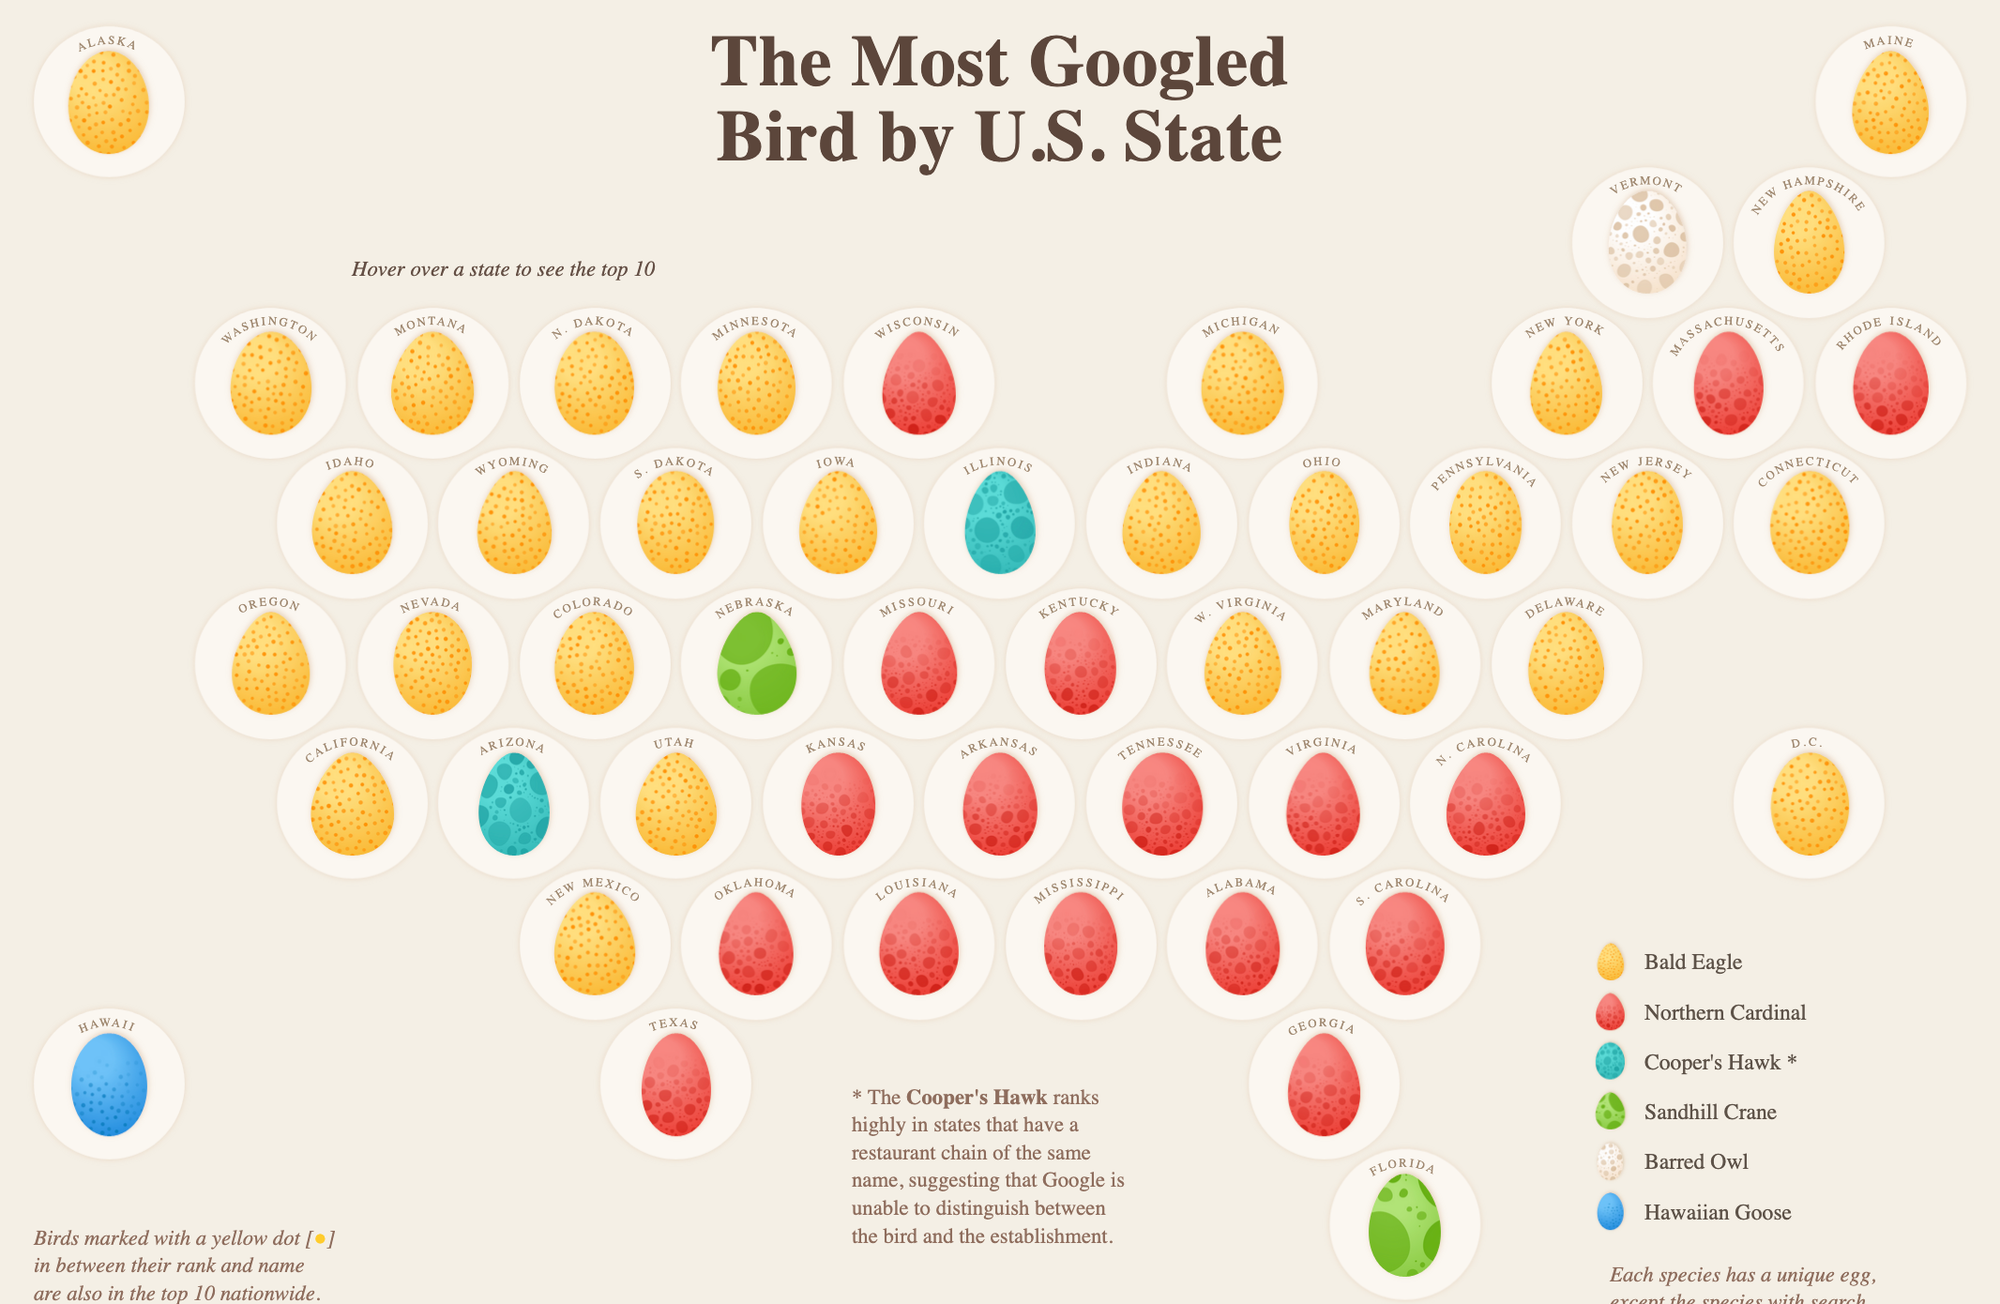
This project is made for bird lovers. It analyzes which birds are the most sought after by Americans. A tremendous amount of work went into compiling data across 50 states, Google Trends, various databases and so on. If Reuter’s project is poetic, Visual Cinnamon built an encyclopedia. Pretty much every arrangement of the data has been visualized. Which bird is most Googled in which state; which bird type is most Googled in which state; in which states are a bird type most Googled; how birds are classified into bird types; specific details of each bird or bird type; correlations between Google searches, reported sightings, and population sizes... you have a question, they have an answer somewhere on the website. A variety of chart forms is deployed, some more successful than others. Like several of the nominees, this one is about exploring and learning from data, and can’t be reduced to Cliff Notes.
Air Pollution – Earth Genome (link)
This project visualizes major sources of air pollution around the world. Unlike the previous two projects, it does not utilize a vertical scroll that reveals a sequence of graphics. Instead, the project consists of a single chart form, which shows motion across space. Space is the old reliable map. The motion is quite ingenious; it shows polluting particles streaming out of these facilities, and spraying the pollution around as wind conditions change over time. The density of the roving dots conveys the amount of pollutants, although I find it challenging to visually compare these densities. The data come from simulations from models. In the ladder of abstraction (link), the designers chose to be less abstract, as the moving dots suggest pollutants (much of which ironically are invisible in real life!) It’s quite fun to stumble upon visual insights, like this:
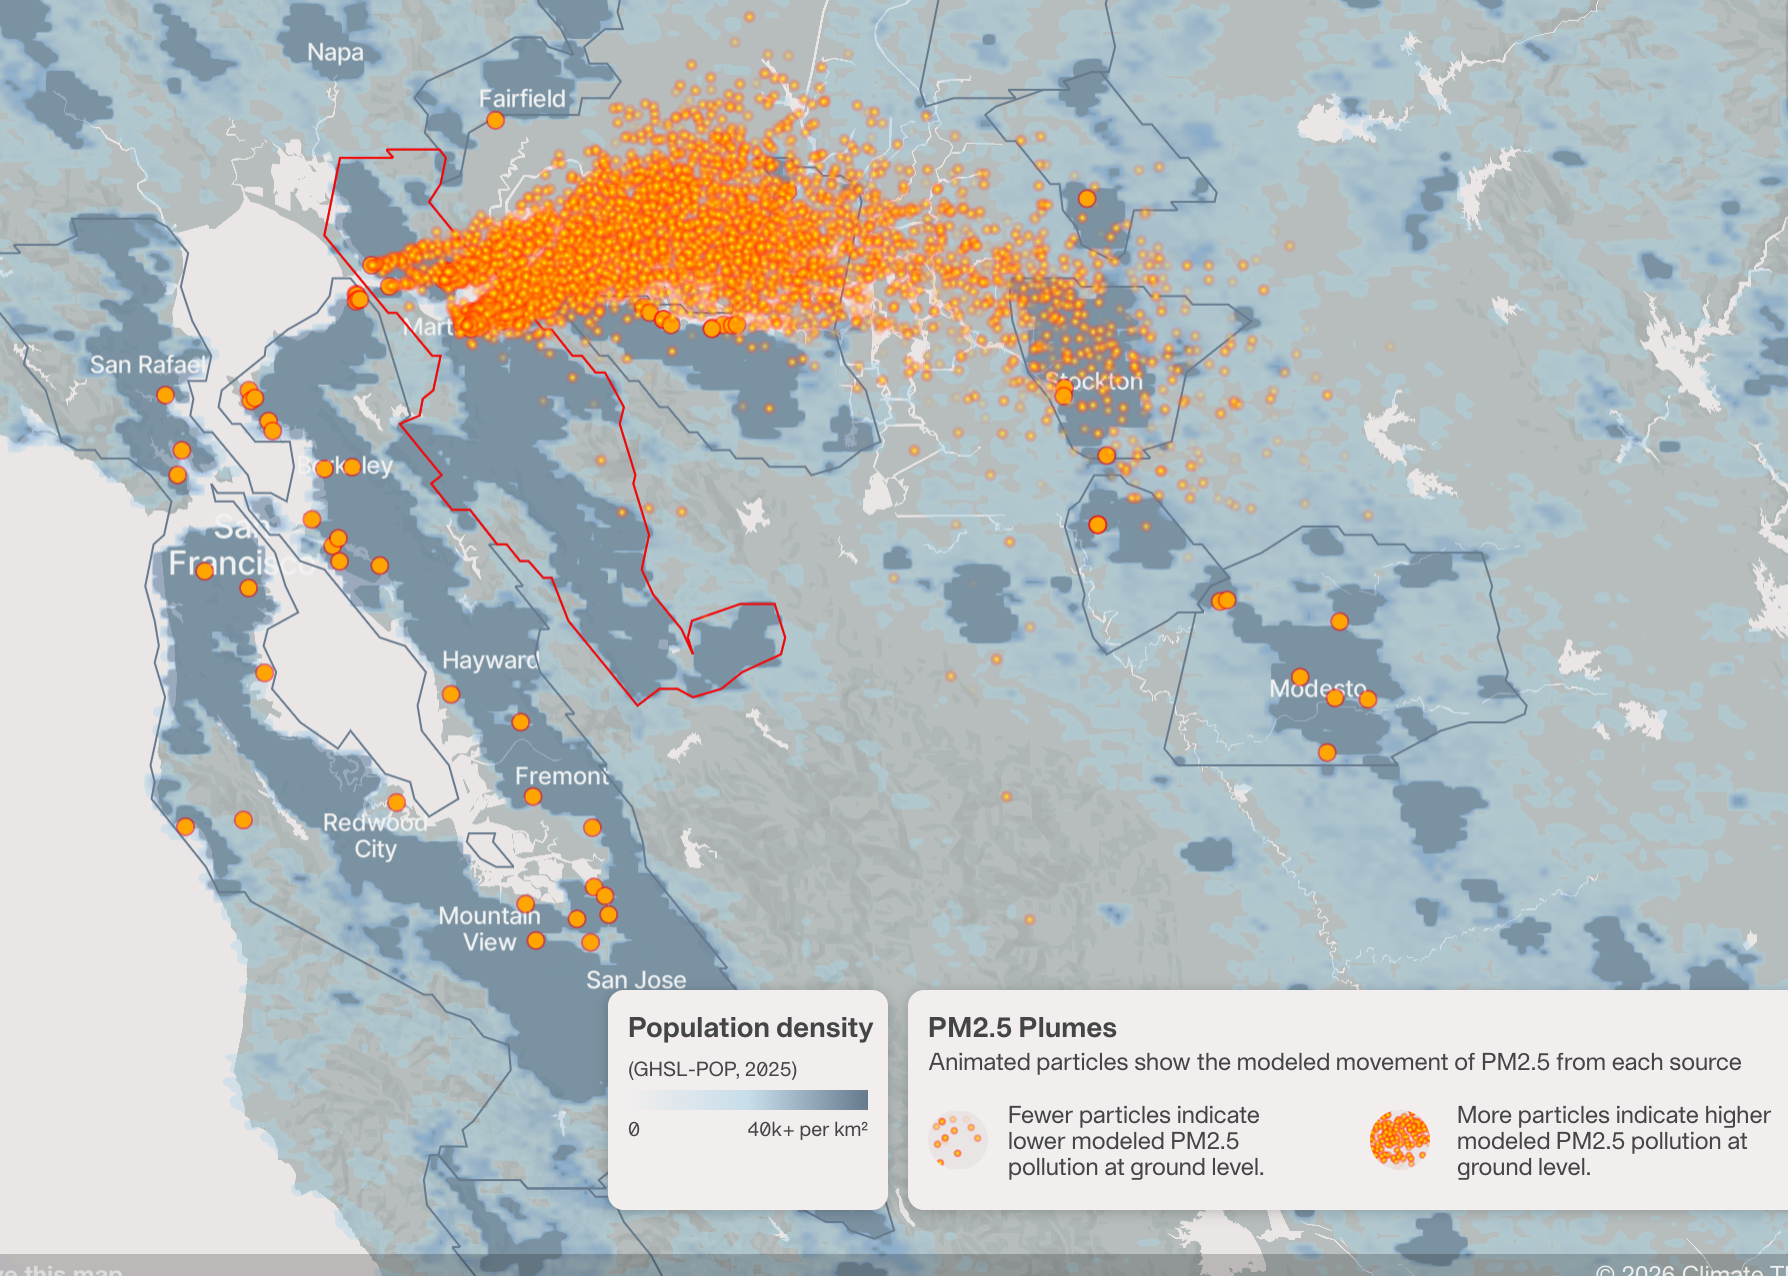
One can see how the emissions from several facilities are blown toward certain population centers during certain times of the day.
Spotify Wrapped (link)
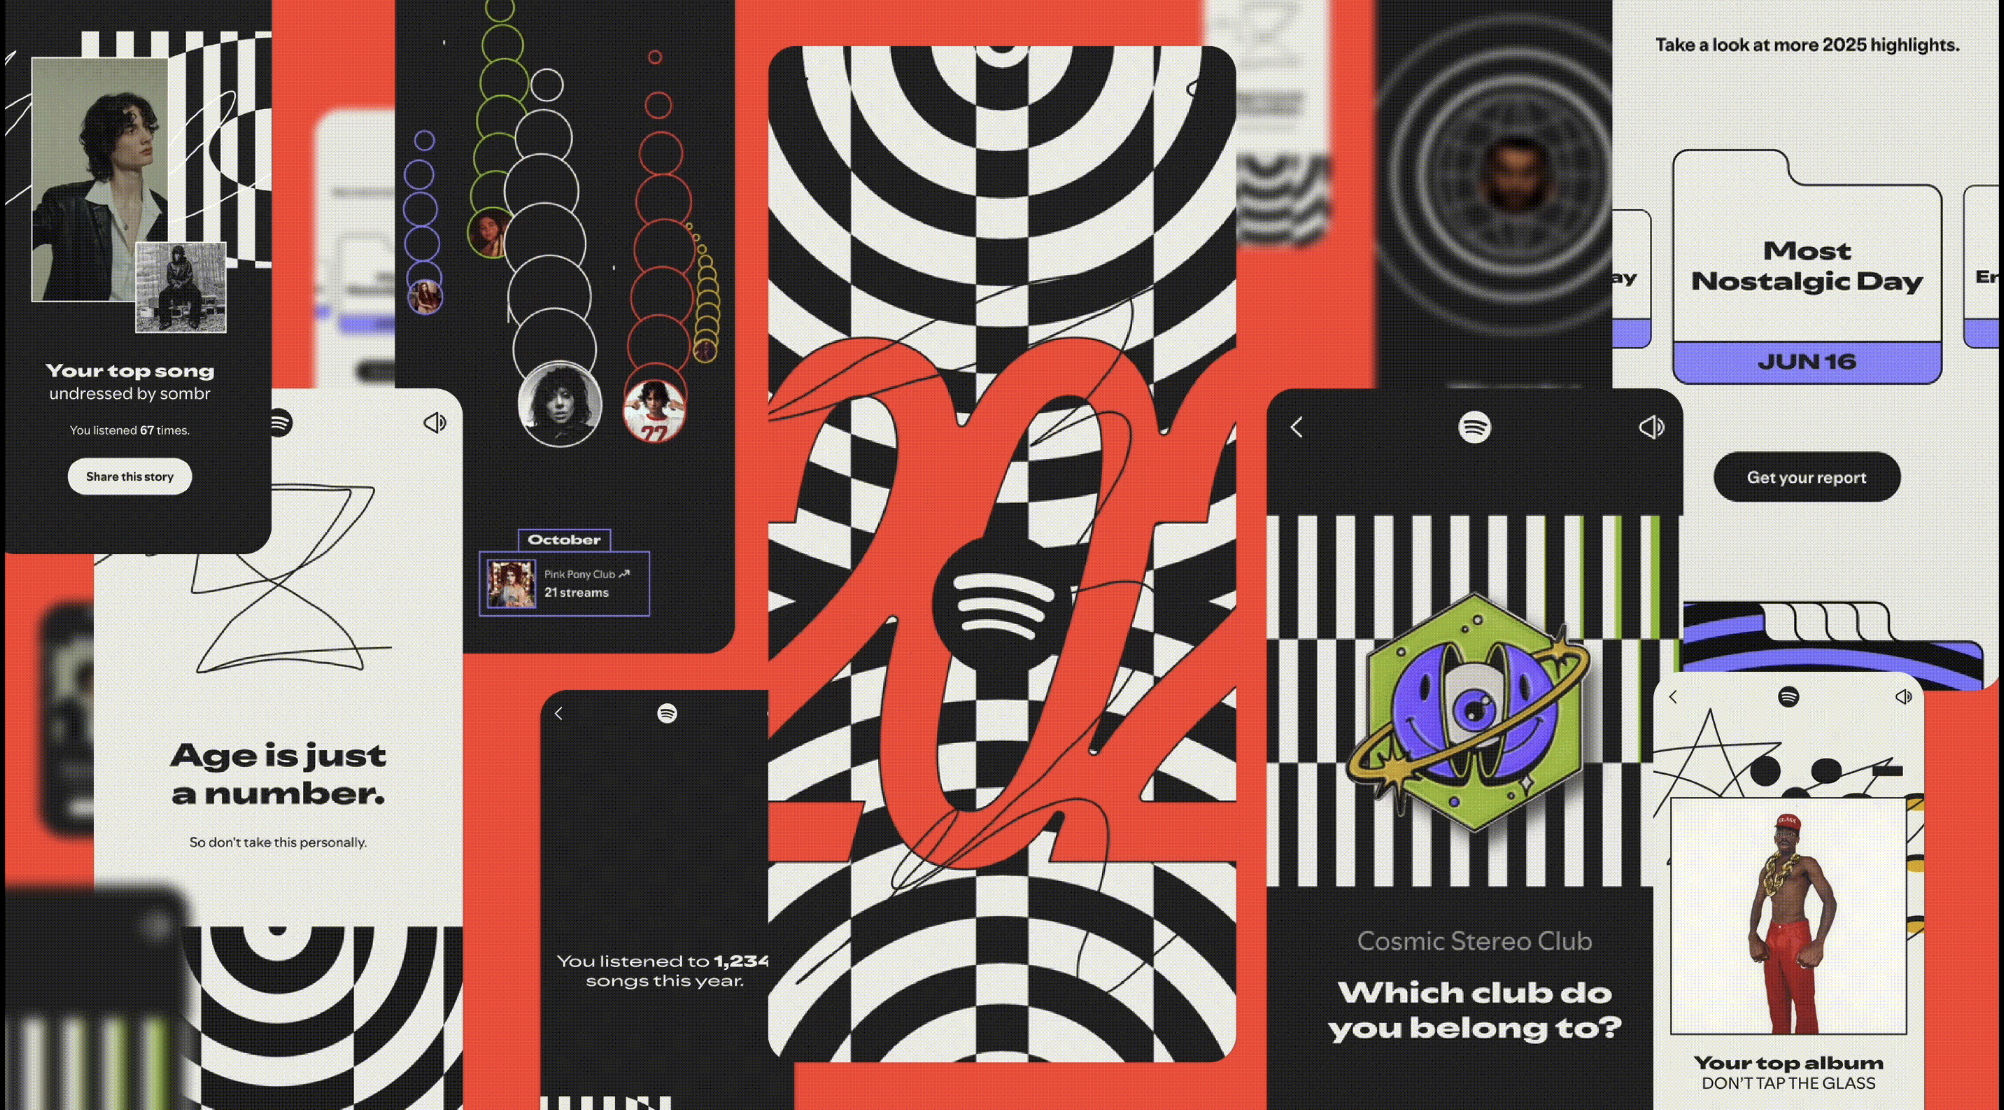
This project is Spotify’s version of the year-end reports that tech companies send out to their users. These reports remind users of their activities on the platform during the past year. This project deserves its own category. It really has little in common with the other nominees. The primary distinction being that it isn’t one size fits all; Spotify automatically creates individualized visual products for its millions of users. It also doesn’t analyze; simple stats are presented in a visually appealing style. The link describes the general design of Wrapped but we don’t have the pleasure of seeing a specific example of it. There is a not-so-obvious trade-off of this mass customization strategy: not all sections of the design will be relevant to all users. Nevertheless, each user isn’t lost inside their entire database.
Blue Corridors – Ode Partners (link)
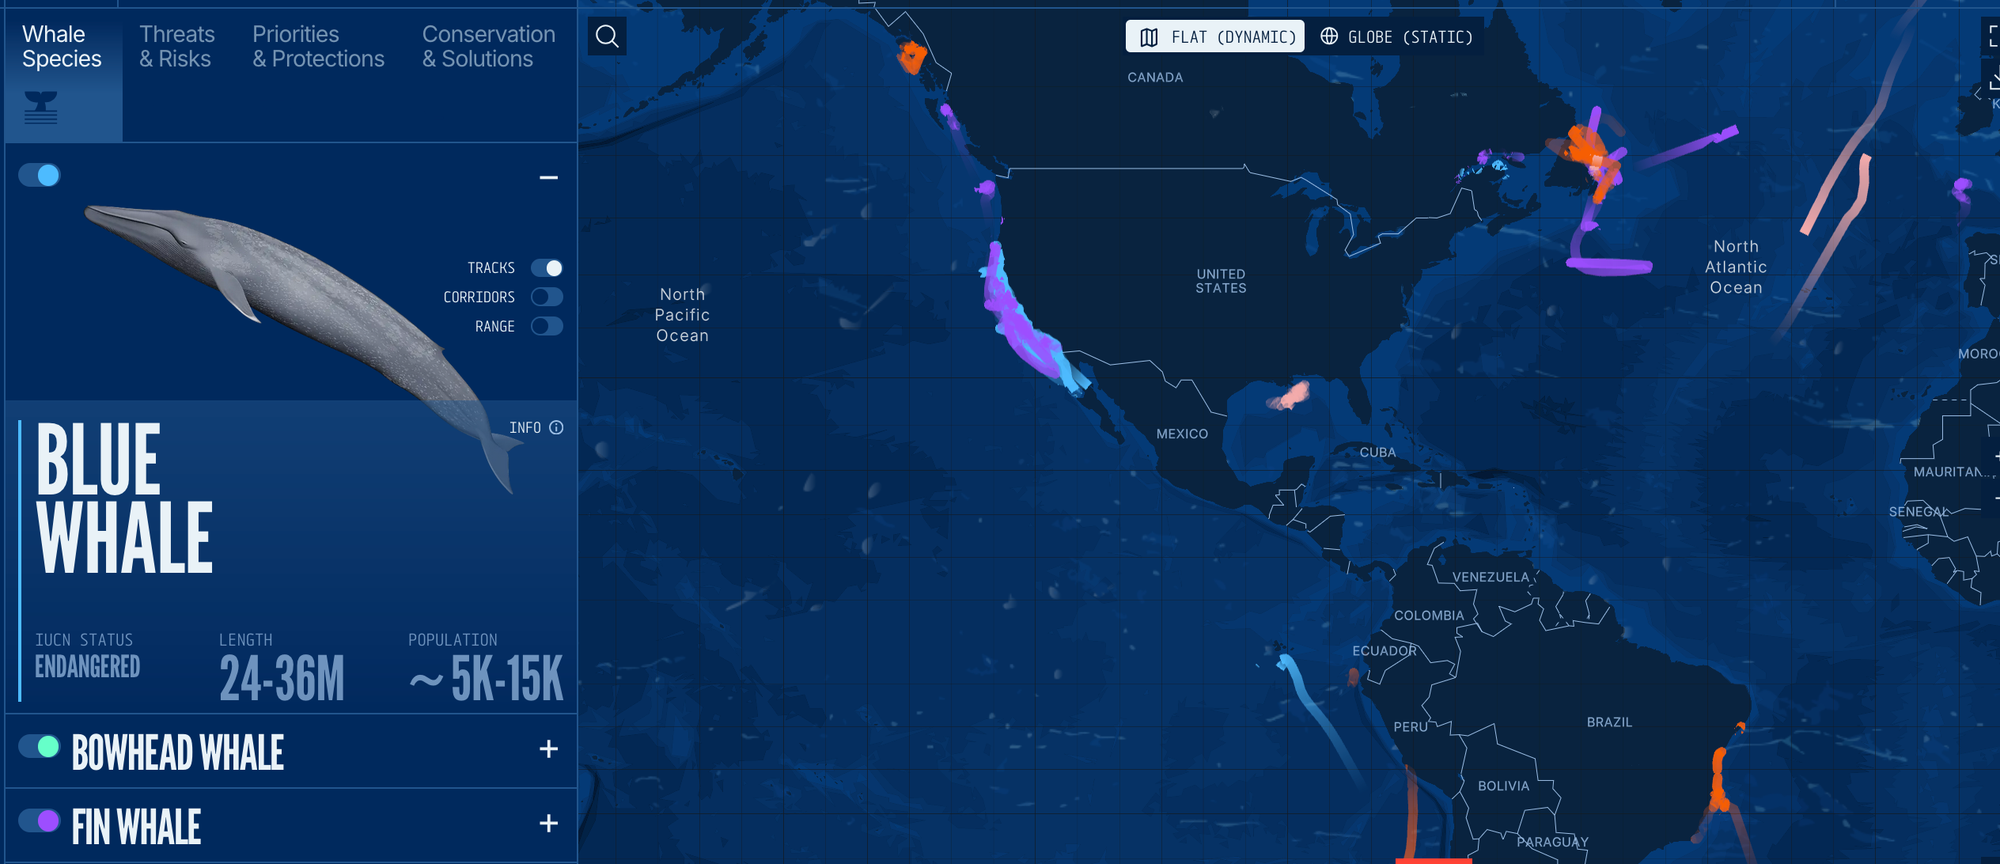
This project shows eight species of whales, and threats to their habitats. In spirit, this data visualization is identical to Earth Genome’s air pollution project. It also shows motion in space. Space is also the reliable map; the twist is the inclusion of a spherical option. The major traces of whales over time are shown dynamically. The project includes every bit of data, for every location, and point in time. Under a different tab, the designers attempt to address tricky cause—effect issues. They deal with this by adding background maps, for example, there’s one that show shipping and vessel strikes. The superposition of dynamic traces and background maps makes for a formidable fishing expedition. Like several others, this project elevates data exploration as the end goal.
P.S. [4/21/2026] Edited the link to the Webby Awards to reflect the new link after the winner is announced. There appear to be two winners: Blue Corridors and Birds. Congratulations!