Junk Charts
  • About
  • RSS
  • Posts by Year
  • Posts by Keywords
Sign in Subscribe

Assumptions

Visualizing hierarchies
sports analytics

Visualizing hierarchies

Bonus: setting gridlines on a circular chart
Read More
VAR technology is ruining football
Analytics-business interaction

VAR technology is ruining football

Two examples of calls that don't improve the experience
Read More
The way of the statistician
Statisticians

The way of the statistician

It wasn't that close after all
Read More
MTA lowers revenues while upping stress on some commuters
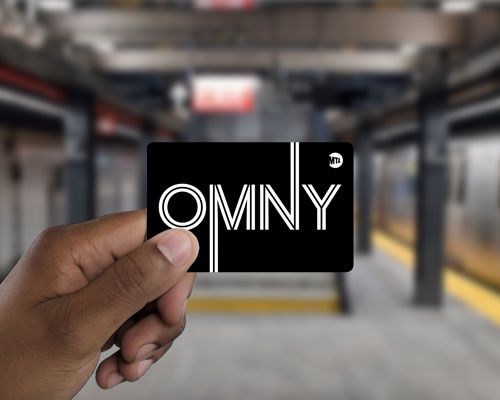
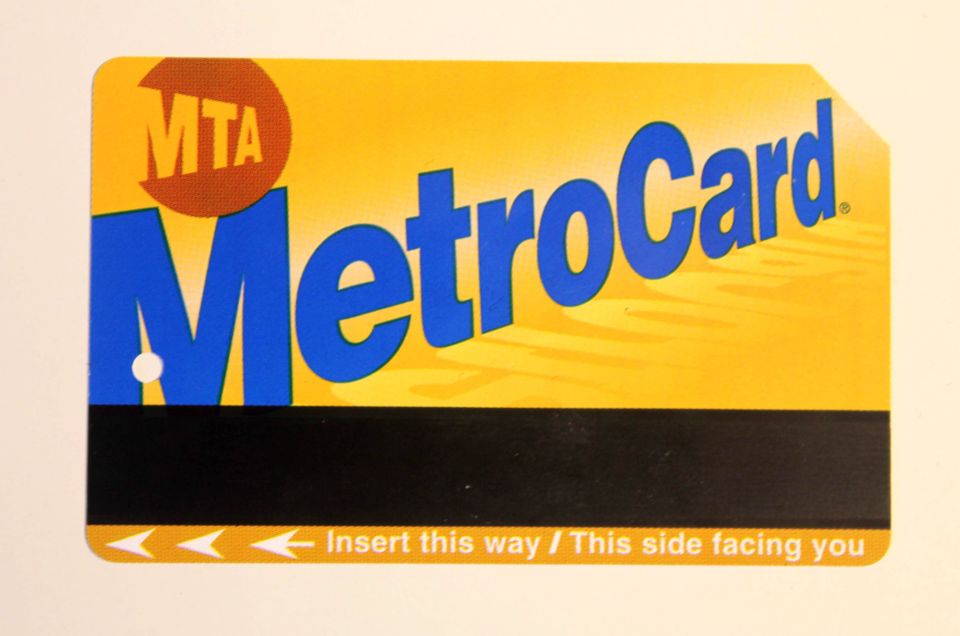
Analytics-business interaction

MTA lowers revenues while upping stress on some commuters

An economic analysis of MTA's switch to OMNY cards
Read More
Story-first governing
story-first

Story-first governing

Pay for performance, story-firsters, and trust in statistics
Read More
OMNY's mind-blowing solution to a math problem
Algorithms

OMNY's mind-blowing solution to a math problem

The unintuitive fare capping scheme for NYC commuters
Read More
Page 1 of 8 Older Posts →
Junk Charts © 2026
  • BOOKS
  • COURSES
  • PRESS
  • CONSULTING
  • COACHING
  • CONTACT
Powered by Ghost