Analytics-business interaction Contaminated science Did lab test results confirm onions as culprits of recent E.coli outbreak?
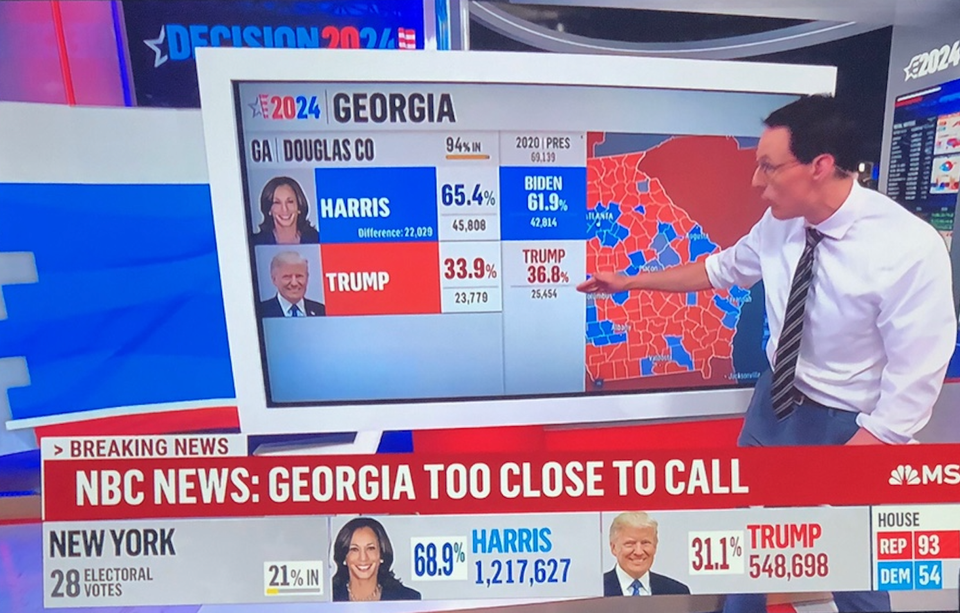
Aggregation Election coverage prompts good graphics Election coverage brings out the best of interactive graphics