Junk Charts
About
RSS
Posts by Year
Posts by Keywords
Sign in
Subscribe
line chart
Bar chart
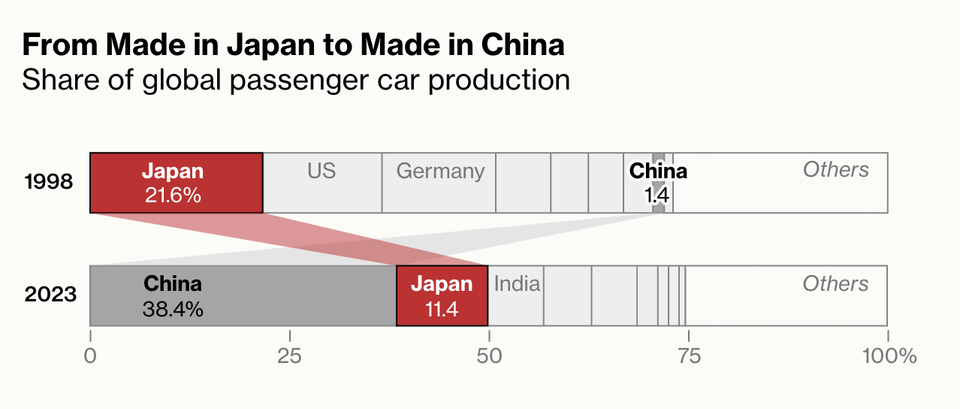
Fantastic auto show from the Bloomberg crew
Bloomberg Graphics put on an auto show
missing data
Criminal graphics graphical crime
Comparing the difference between two lines
Aggregation
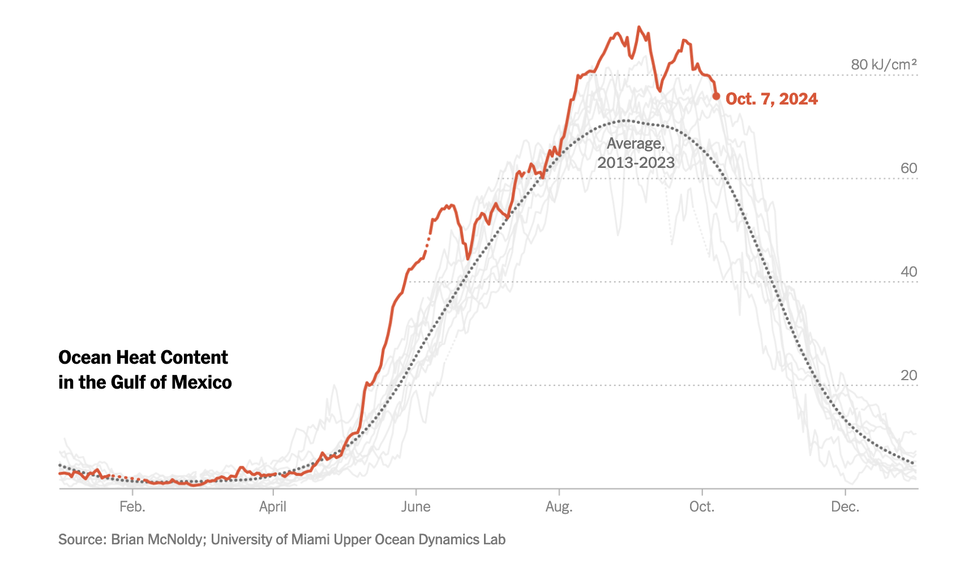
Visualizing extremes
Nice NYT chart showing weather extremes
Background
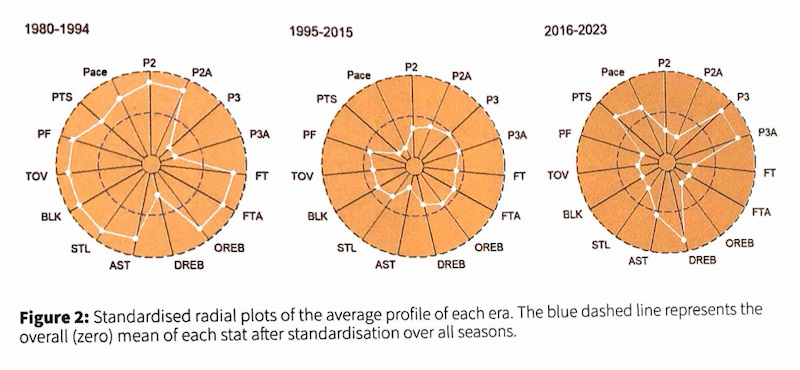
The radial is still broken
Kaiser puzzles out yet another radial chart.
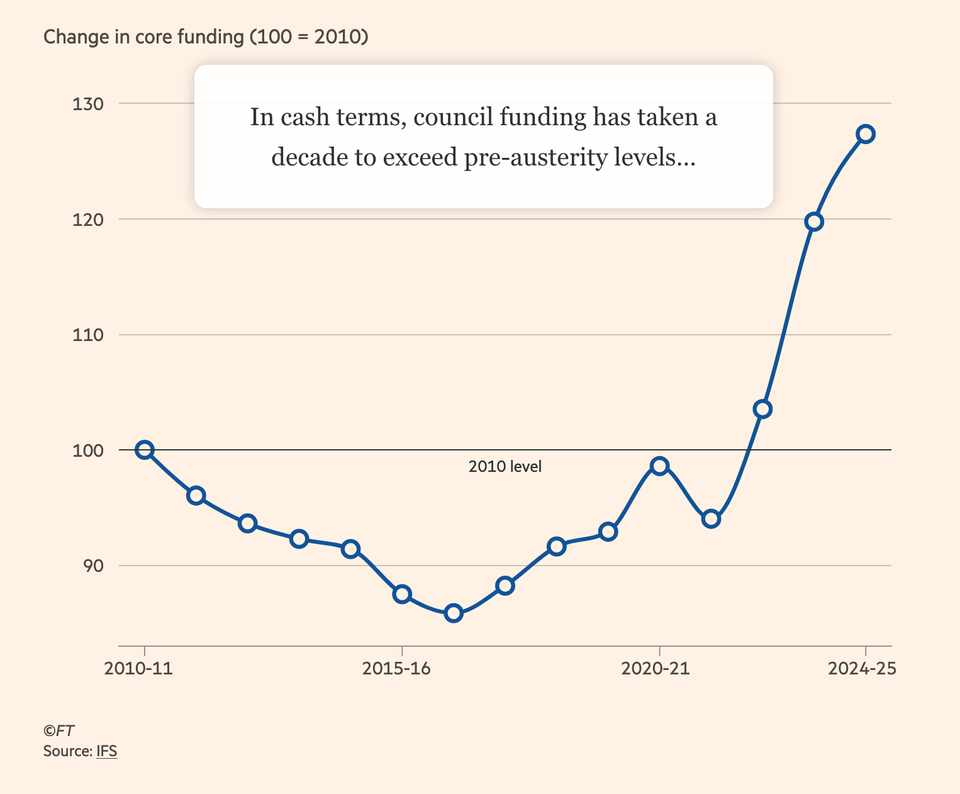
Axis
Adjust, and adjust some more
Kaiser looks at an interactive chart in the Financial Times.
Bar chart
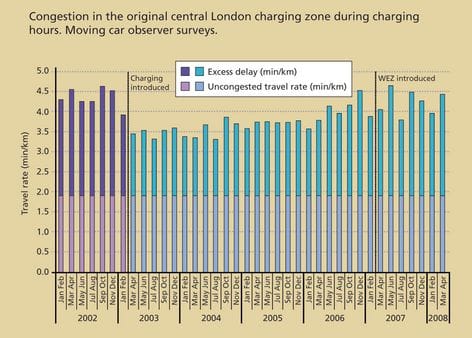
Excess delay
Kaiser finds a chart that analyzes London's congestion charging programme.
←
Newer Posts
Page 4 of 17
Older Posts
→