Junk Charts
  • About
  • RSS
  • Posts by Year
  • Posts by Keywords
Sign in Subscribe

Time series

Visual analogies
Axis

Visual analogies

Many a startling faux pas in graphics start with the desire to
Read More
The trouble with two lines
Axis

The trouble with two lines

It's never a good idea to put two scales on
Read More
Mind the gap
Business

Mind the gap

When comparing two time series, one typically wants to discuss the size
Read More
How to read a graph
Blogs

How to read a graph

Via Gelman, here is a nifty book-buying map from Amazon, displaying the
Read More
Political theater
Background

Political theater

Jens, a long-time reader, tried to re-make the boring data tables used
Read More
Loss aversion
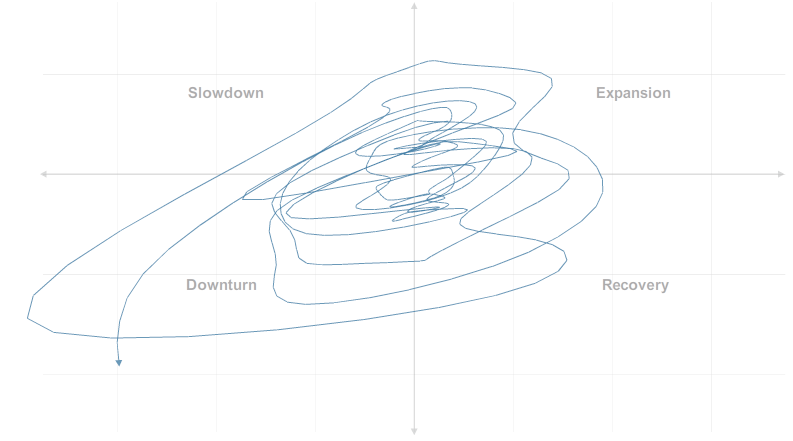
Aggregation

Loss aversion

Loss aversion manifests itself in chart-making, as it does in economics.  In
Read More
← Newer Posts Page 18 of 21 Older Posts →
Junk Charts © 2025
  • BOOKS
  • COURSES
  • PRESS
  • CONSULTING
  • COACHING
  • CONTACT
Powered by Ghost