Junk Charts
  • About
  • RSS
  • Posts by Year
  • Posts by Keywords
Sign in Subscribe

Time series

the wtf moment
Bar chart

the wtf moment

the wtf moment in dataviz
Read More
Dizziness
Bar chart

Dizziness

Dizziness is probably not an intended goal of charting
Read More
Election coverage prompts good graphics
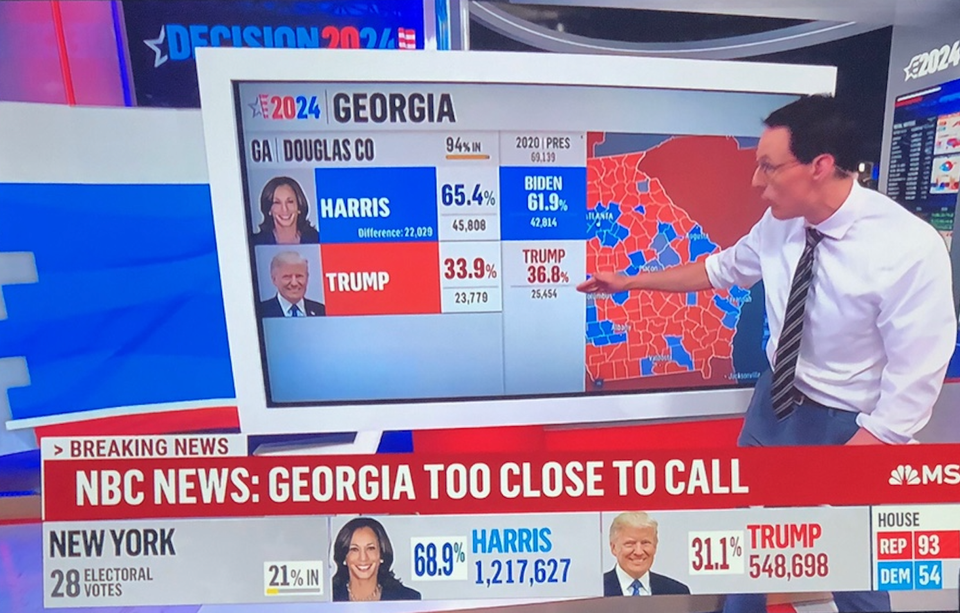
Aggregation

Election coverage prompts good graphics

Election coverage brings out the best of interactive graphics
Read More
Visualizing extremes
Aggregation

Visualizing extremes

Nice NYT chart showing weather extremes
Read More
Aligning the visual and the message to hot things up
Color

Aligning the visual and the message to hot things up

How hot is Phoenix
Read More
Tidying up the details
Bar chart

Tidying up the details

Fixing up little details on a data graphic pays dividends
Read More
← Newer Posts Page 6 of 20 Older Posts →
Junk Charts © 2025
  • BOOKS
  • COURSES
  • PRESS
  • CONSULTING
  • COACHING
  • CONTACT
Powered by Ghost