When statistical models fail
Not a good look when the stakes were high
An investigative article just appeared in BMJ that has important statistical content (link).
The problem concerns turning raw data on “adverse events” (side effects) related to the Covid-19 vaccines into statistical “red flags”. How do we know if the number of reported events is large enough to sound the alarm?
This problem exists even before the development of Covid-19 vaccines. Those vaccines just made the scale of everything much larger, since so many people got vaccinated.
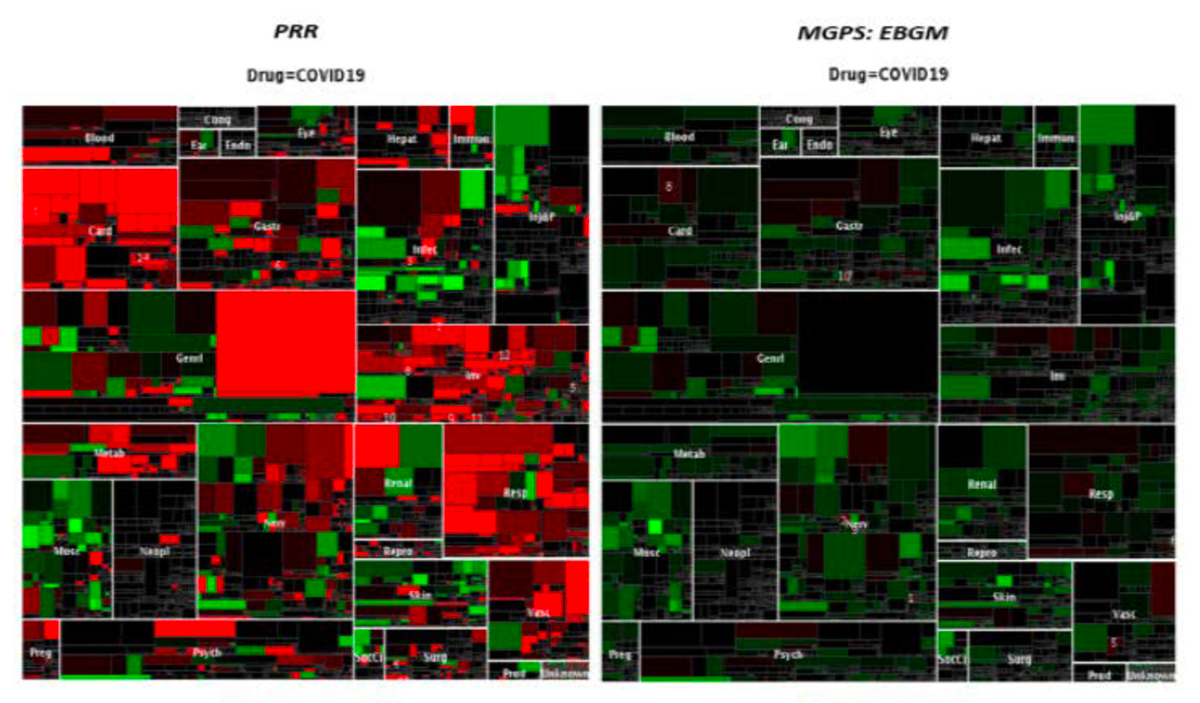
Two statistical methods were mentioned in the article. The first method is called “proportional reporting ratios” (PRR). The second method is dubbed “empirical Bayes”.
BMJ reports that the CDC leadership only relied on the empirical Bayes method during the pandemic. This is controversial because the investigation discovered that the two methods yielded diametrically opposite results. Each method produced extreme results but in opposite directions!
The empirical Bayes method produced zero signals while the PRR method was blaring alerts everywhere. Sadly, this episode just points to the inadequacy of both statistical methods: the former suffers from massive false negatives; the latter from massive false positives.
Why does the empirical Bayes method lead to many false negatives? We can trace its faults to the design. The method uses a set of highly conservative assumptions, presumably chosen to minimize the chance of false alarms. Think of a deafening fire alarm bell, and turning the volume down to the point when no one can hear it anymore.
The method starts with a standard statistical concept: the null distribution. Let’s look at one of the acknowledged side effects of the vaccines: myocarditis. We assume – in the “null” case – that the vaccines do not cause myocarditis. Under this assumption, the expected number of myocarditis cases for vaccine-takers is the number of people who took the vaccine, multiplied by the rate of myocarditis in the general population. This value measures the "background" rate of myocarditis, disregarding the impact of the Covid-19 vaccines.
Next, the observable number of cases is modeled as a multiplier times the expected count. This multiplier is not directly measurable, and its value is chosen to fit the actual observed data in all combinations of drugs and events. (For those wanting to learn more, the method is named Modified Gamma Poisson Shrinker.)
There are three design choices that minimize false signals.
The first, known as “shrinkage”, automatically pulls the observed counts toward the expected counts. The idea is to strike a balance between the data and one’s prior belief. In this case, the “prior” is the “null”, meaning the belief that the vaccines are not associated with myocarditis.
The second is to use geometric means, rather than arithmetic means when summarizing the posterior distribution. Geometric means has the effect of suppressing large signals.
The third way in which this empirical Bayes procedure loads up conservatism is subtler.
The procedure compares the expected cases for a given drug-event combination to the observed cases. The number of expected cases is also affected by the observed data. In fact, as the observed cases go up, so too do the expected cases. It turns out that the signal creates its own null benchmark.
These are three key observations in the Covid-vaccines–myocarditis analysis:
- The number of reports involving Covid vaccines (regardless of side effect)
- The number of reports involving myocarditis (regardless of drug)
- The total number of reports across all drugs and all side effects
During the pandemic, the number of reports skyrocketed, and over 90% of them involved Covid vaccines. Even amongst myocarditis events, most reports were related to Covid vaccines. As a result, the expected number of cases in the Covid-vaccine–myocarditis category was high. Since this expected number of cases is assumed to be the “null” scenario, this methodology asserts that as a baseline case, we expect to find a big pile of myocarditis reports that also mention Covid vaccines even if there exists zero dependence between the treatment and the adverse event!
Not surprisingly, no safety signals were found.
Then again, the other method (PRR) fared no better. It erred in the other direction, crying wolf on almost everything.
The Proportional Reporting Rate is the number of myocarditis–Covid-vaccines events divided by the number of Covid-vaccine events; in other words, the proportion of reports involving drug X that also involve event Y.
The “control” value is the proportion of reports involving drugs “not X” that also involve event Y.
The idea is that if drug X causes event Y, we expect the test value to exceed the control value meaningfully. In this case, one assumption is that there are no popular drugs in the "not X" group that cause event Y. A violation of this assumption might be if the Pfizer vaccine is drug X and the Moderna vaccine is part of the "not X" group. During the pandemic, the reports in the "not X" group were dominated by reports about Moderna so again we have an instance of a signal creating its own null benchmark.
Another issue is multiple comparisons. There may be hundreds or thousands of drugs in the reporting system, and hundreds of events. If a test is run for every drug-event pair, we are running an enormous quantity of tests. In these situations, we want to control the omnibus error rate, which means that we should be much more conservative when sounding the alarm in any particular test.
The BMJ article contains more reporting on how some scientists warned the FDA about the flaws of the empirical Bayes method, which fell on deaf ears (link).