Speak loudly
Is this a good or bad chart?
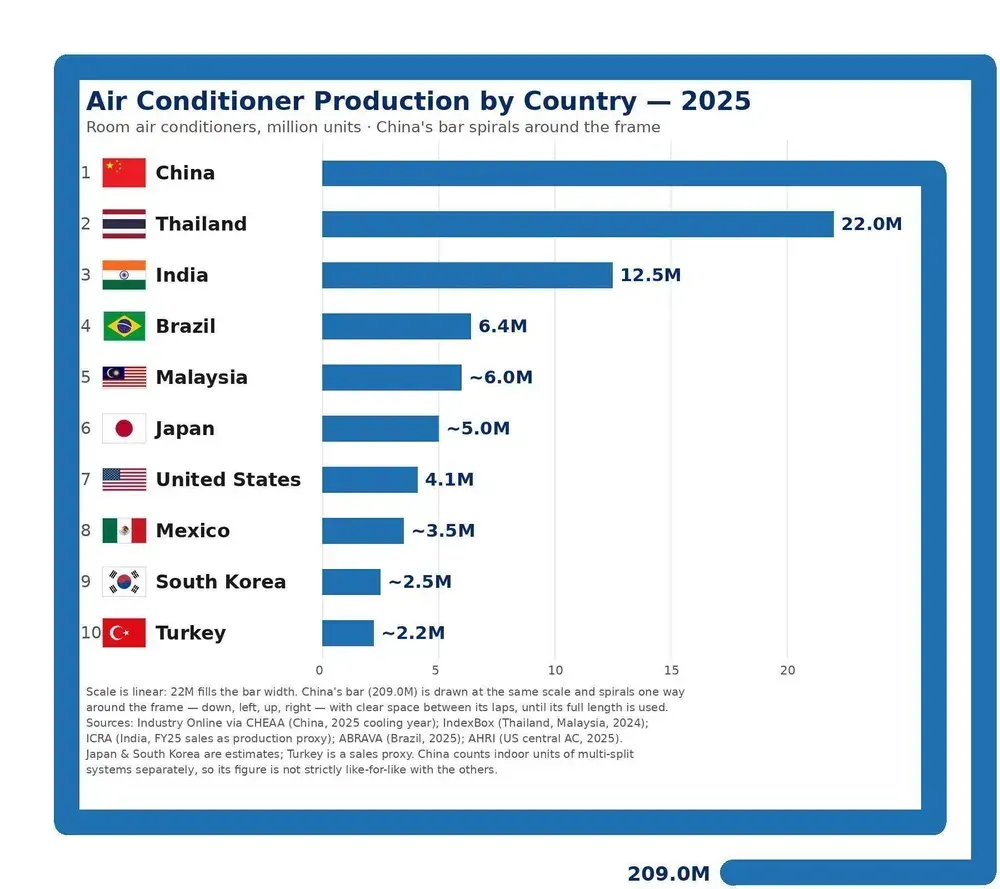
Long-time reader Mark P. found this chart on BlueSky.
Am I upset about this bar chart?
Not really. I like charts to speak loudly and this one for sure fits the bill.
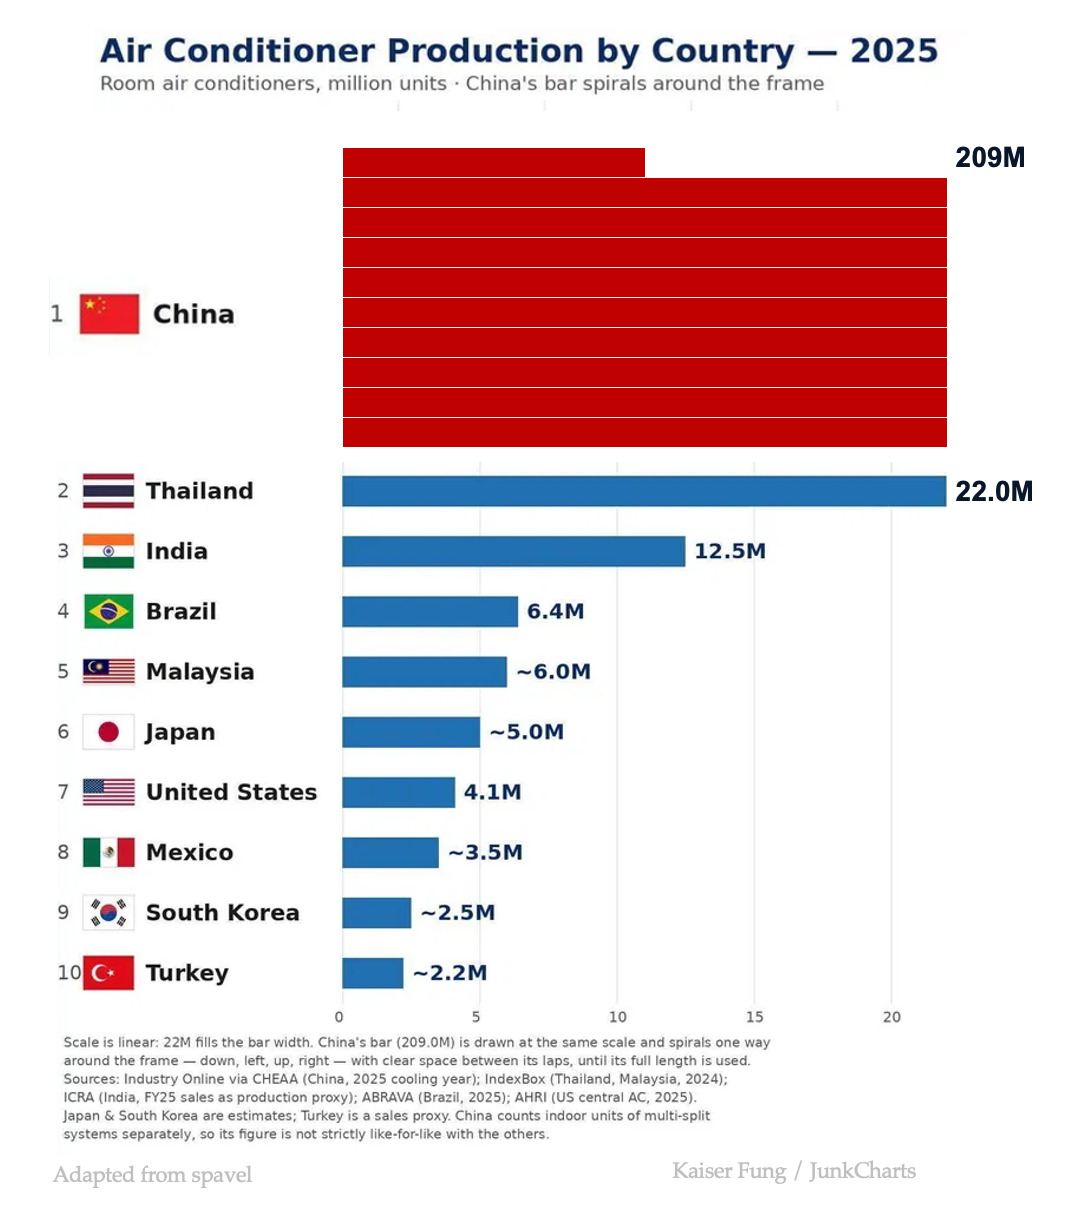
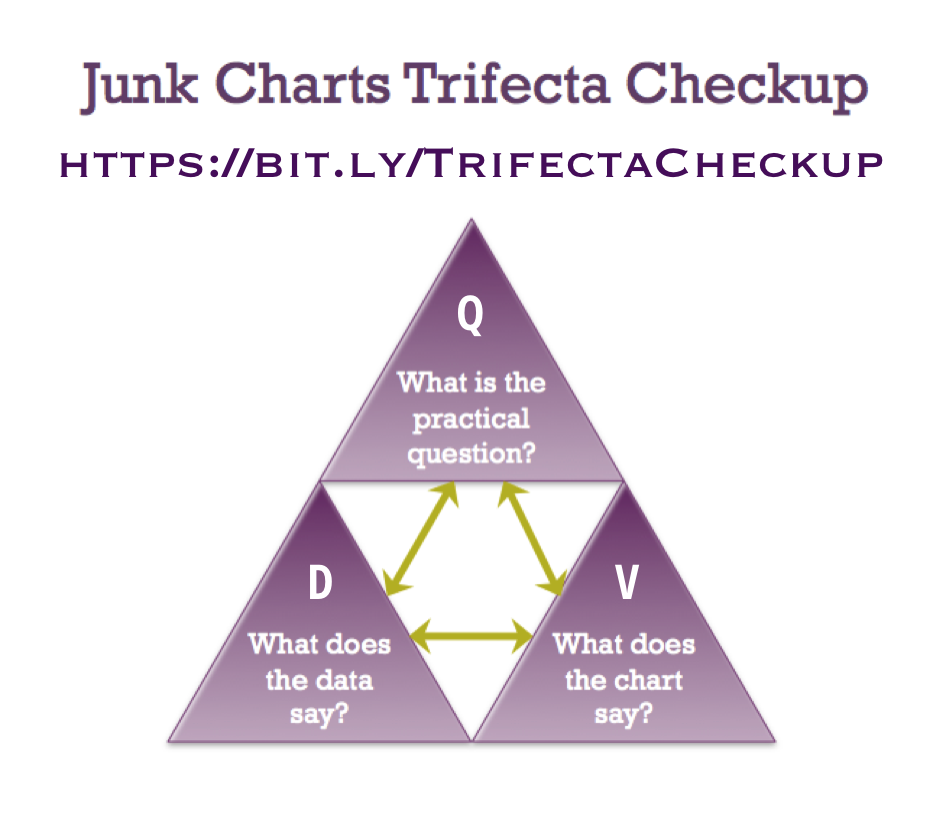
China is far and away the biggest producer of air conditioners. That's the message of the data, and that's the visual message. They are well-aligned. That's the green arrow between the D and V corners in the Trifecta Checkup.
If you've been around here, you know I'm fond of my ruler. Let's see if the chart is drawn to scale.
Indeed, the total length of the various segments of China's bent bar is about 200 so the data are faithfully represented.
This whimsical chart is vastly preferable to two popular alternatives: plotting the log values, and adding an artificial break in the bar. Either of these tactics kills the message.
Is there a less controversial option? Here's one: